

Every developer has been there. You run your code. It crashes. A wall of text appears-line numbers, file paths, method names, nested function calls-all screaming at you to figure out what went wrong. You stare at it. You scroll. You Google. You waste 45 minutes. Then you realize: you’re not just debugging code. You’re decoding a story written in reverse.
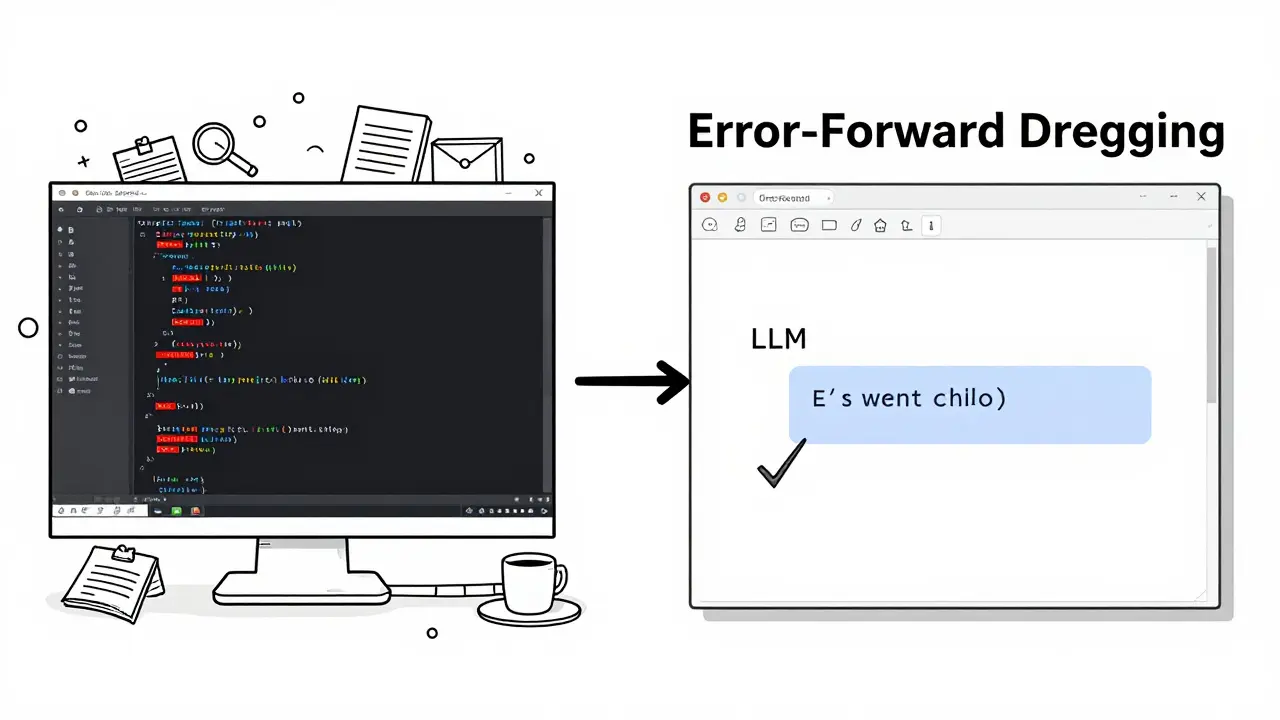
That’s where error-forward debugging changes everything. Instead of wrestling with stack traces yourself, you feed them directly to an LLM. The model reads the chaos, understands the sequence of failures, and gives you a plain-English explanation with a fix. No more guessing. No more hunting through 20 files. Just a clear path forward.
What Is Error-Forward Debugging?
Error-forward debugging isn’t magic. It’s a workflow. You take the raw stack trace from your crash-what your program wrote right before it died-and send it to an LLM like GPT-4, Claude, or a specialized model trained on code. The LLM doesn’t just see text. It sees a timeline: Function A called Function B, which called Function C, which tried to access a null value on line 142 of utils.py.
Traditional debugging forces you to be the interpreter. Error-forward debugging lets the LLM do that heavy lifting. You’re not asking, “What does this mean?” You’re asking, “What happened here, and how do I fix it?”
This approach works because stack traces are structured. They follow a Last-In, First-Out pattern. The last function called is at the top. The root cause is usually buried underneath. LLMs are surprisingly good at spotting patterns in this structure-especially when you give them the surrounding code, environment details, and error messages.
How It Works: The Pipeline
Here’s the real workflow, step by step:
- Capture the full stack trace. Enable debug symbols. In .NET, use
new StackTrace(true). In Python, usetraceback.print_exc(). Don’t cut corners-missing line numbers or file paths hurt accuracy. - Enrich it with context. Add the environment (e.g., Python 3.12, Docker container, VSCode), timestamp, and any relevant input data. If it’s an LLM app, include the prompt and retrieved context. Tools like Raygun and Symflower do this automatically.
- Send it to the LLM. Use a prompt like: “Here’s a stack trace from a production error. What’s the root cause? What’s the most likely fix? Show me the exact line to change.”
- Review, test, apply. The LLM might suggest a fix. Don’t copy-paste blindly. Run it in a test environment. Verify it doesn’t break something else.
That’s it. No complex setup. Just a few lines of code and an API key.
Why This Beats Traditional Debugging
Let’s say you’re debugging a Python script that crashes with a KeyError in a nested dictionary. Traditional method? You open the file, trace the variable flow, check if the key exists in all branches, add print statements, rerun, repeat. Takes 20-40 minutes.
With error-forward debugging? You copy the stack trace-File "processor.py", line 89, in extract_data → KeyError: 'user_id'-paste it into your LLM tool, and get back: “The error occurs because the input data doesn’t always include a ‘user_id’ field. Add a default check: user_id = data.get('user_id', 'unknown').” Done in 90 seconds.
Benchmark data from Kuldeep Paul’s 2024 study shows engineers using this method cut debugging time by 63%. For complex LLM pipeline errors, median resolution time dropped from 2.7 hours to under an hour.
It’s especially powerful for:
- Unknown AST node errors in code generators
- Retrieval failures in RAG systems
- Intermittent crashes in distributed services
- Java or .NET stack traces that look like hieroglyphs
Tools like Symflower and Raygun now automate this. They capture the trace, enrich it, and send it to an LLM in the background. You get a fix suggestion in your IDE.
What You Need to Get Started
You don’t need a PhD to use this. But you do need:
- A way to capture full stack traces. Turn on debug info in your runtime. For Python, use
import traceback; traceback.print_exc(). For Node.js, useconsole.error(error.stack). - An LLM API. OpenAI, Anthropic, Hugging Face-all work. You’ll need an API key. Hugging Face requires
HF_TOKENauthentication. - A context window big enough. Complex traces can be 5K-10K tokens. Use models with at least 8K context. GPT-4-turbo handles it fine.
- A simple prompt template. Example: “I got this error in production. Here’s the full stack trace and the code around line 145. What’s the root cause? What’s the safest fix? Show me the exact change.”
For Jupyter users, there’s a magic command: %load_ext llm_exceptions. Run it, and any error you get is auto-analyzed by the LLM. No copy-pasting needed.
Where It Fails-and Why You Shouldn’t Blindly Trust It
This isn’t a silver bullet. LLMs hallucinate. A 2024 study by Symflower found that 18.7% of LLM-generated fixes were wrong. In safety-critical systems, Stanford researchers found 23% of suggested fixes introduced new edge-case bugs.
Here are the top failure modes:
- Wrong fix for the wrong reason. The LLM sees a null pointer and suggests a null check-but the real issue is a race condition in a multi-threaded call.
- Missing context. If you don’t send the environment or input data, the LLM guesses. Bad guesses lead to broken code.
- Token limits. Huge traces get chopped. Tools like LLM Exceptions split traces into 2K-token chunks, but that adds 12-15% latency.
- Domain-specific errors. If your error is in a niche library or custom framework, the LLM might not have seen it before. Accuracy drops to 68% in these cases, compared to 92% for common errors.
Always treat LLM suggestions as a starting point. Test them. Write a unit test that reproduces the error. Then verify the fix works.
Privacy and Enterprise Concerns
Many companies won’t send code to cloud LLMs. It’s a legal and security risk. That’s why tools like Wandb and Symflower now offer on-premises options. You can run the LLM locally-on your own server-using models like CodeLlama or StarCoder.
For regulated industries (healthcare, finance), this isn’t optional. It’s required. The future of error-forward debugging is hybrid: cloud for speed, on-prem for security.

Real User Experiences
On GitHub, the LLM Exceptions project has over 2,800 stars. Users report:
- “70% faster debugging for Jupyter notebook crashes.”
- “Finally understood why my Django API kept returning 500s.”
- “Saved me hours on a weird pandas merge error.”
But Reddit users warn:
- “Junior devs are copying LLM fixes without understanding them.”
- “I got a fix that worked in test but broke production. Took me days to track down why.”
The pattern is clear: it’s a powerful tool for beginners and experts alike-but it’s not a replacement for deep understanding.
The Bigger Picture
Error-forward debugging is part of a larger shift: AI as a co-pilot in software development. It’s not about replacing developers. It’s about removing friction. Debugging used to be a bottleneck. Now, it’s becoming a speed bump.
Gartner predicts 60% of mainstream IDEs will have built-in LLM stack trace analysis by 2026. By 2027, 85% of commercial debugging tools will include it. The $478 million AI debugging market is growing fast-and error-forward debugging is leading the charge.
For AI engineering teams, it’s already essential. Diagnosing retrieval failures in RAG systems? That used to take days. Now, it takes minutes. The stack trace tells the whole story. The LLM just reads it aloud.
How to Start Today
Here’s your 10-minute plan:
- Find the last error in your logs. Copy the full stack trace.
- Go to your favorite LLM chat (ChatGPT, Claude, etc.).
- Paste the trace. Add: “What’s the root cause? What’s the fix? Show me the exact line to change.”
- Run the suggested fix in a test environment.
- Write a test case to prevent it from happening again.
That’s it. You’ve just done error-forward debugging.
Don’t wait for your company to adopt a tool. Start small. Use it on your own projects. You’ll be amazed how fast you go from “What is this error?” to “Oh, that’s an easy fix.”
 Artificial Intelligence


Ronnie Kaye
January 18, 2026 AT 11:43So you're telling me I can just paste my 500-line stack trace into ChatGPT and it'll magically fix my code like it's my overworked junior dev who actually knows what they're doing? I'm sold. Next thing you know, AI will write my PR descriptions too. "Fixed the bug, no cap."
Priyank Panchal
January 19, 2026 AT 10:53This is why Indian devs are still better than you. We debugged stack traces with just a terminal and a prayer before you had LLMs. Now you outsource thinking to a bot and call it innovation. Pathetic.
Michael Gradwell
January 20, 2026 AT 22:31LLMs fix bugs? Lol. I once asked one to fix a segfault and it told me to "reinstall my OS and believe in myself." I did. It didn't help. Still got segfaults. But hey at least I felt better about it.
Flannery Smail
January 21, 2026 AT 19:05So you're saying the future of debugging is letting a glorified autocomplete tell you what's wrong with your code? Cool. I'll just let my toaster debug my Kubernetes cluster next. At least it's got a better track record than GPT-4 when it comes to toast.
Emmanuel Sadi
January 23, 2026 AT 10:16Oh wow, so now we're outsourcing our cognitive load to a language model that hallucinates fixes and then we blame the AI when production burns down? Congrats, you've turned debugging into a game of Russian roulette with a 1 in 5 chance of introducing a new bug that takes 3 weeks to find. Welcome to 2025, where devs are just QA for AI.
Nicholas Carpenter
January 24, 2026 AT 20:37I tried this last week on a weird Django error and it actually gave me a working fix in 45 seconds. Didn't copy-paste it though-checked the logic, wrote a test, pushed it. Saved me 3 hours. I'm not saying it's perfect, but it's like having a senior dev on standby who never sleeps. Just don't treat it like gospel. Use it as a tool, not a crutch.
Kate Tran
January 25, 2026 AT 21:35i tried this with a pandas merge error and it said "add a fillna()" but the real issue was a dtype mismatch i didnt even think to check. still saved me time tho. also why does everyone spell "stacktrace" as one word? its two. just saying.
amber hopman
January 26, 2026 AT 15:51What I love is how this flips the script-you’re not trying to reverse-engineer a crash, you’re just handing it to something that’s trained on millions of them. I’ve used this on RAG pipeline failures and it’s like the LLM reads the stack trace like a novel. But yeah, always test. I once got a "fix" that added a try/except around a DB call and it swallowed all errors. Took me 2 days to realize why my metrics were broken.
Deepak Sungra
January 27, 2026 AT 20:29Bro this is literally the dumbest thing I've ever read. You're telling me you're not gonna learn how to read a stack trace because some bot did it for you? What's next? AI writes your unit tests? AI explains why your code doesn't work? You're not a developer, you're a prompt engineer who got lazy. And now you're gonna blame the AI when your app crashes because it "suggested" a fix that ignored thread safety. Classic.
Samar Omar
January 29, 2026 AT 15:07Let me be blunt: this isn't debugging-it's intellectual surrender. Stack traces are not mere noise to be sanitized by a statistical parrot trained on GitHub repos. They are the sacred chronicles of programmatic failure, the linguistic archaeology of causality, the whispered confessions of a dying system. To reduce them to a prompt template and hand them off to a probabilistic oracle is not innovation-it is epistemological nihilism dressed up as efficiency. The true engineer doesn't outsource understanding. They sit with the chaos. They learn its grammar. They become fluent in the language of failure. And only then-only then-do they dare to intervene. This isn't the future of development. It's the elegy for it.