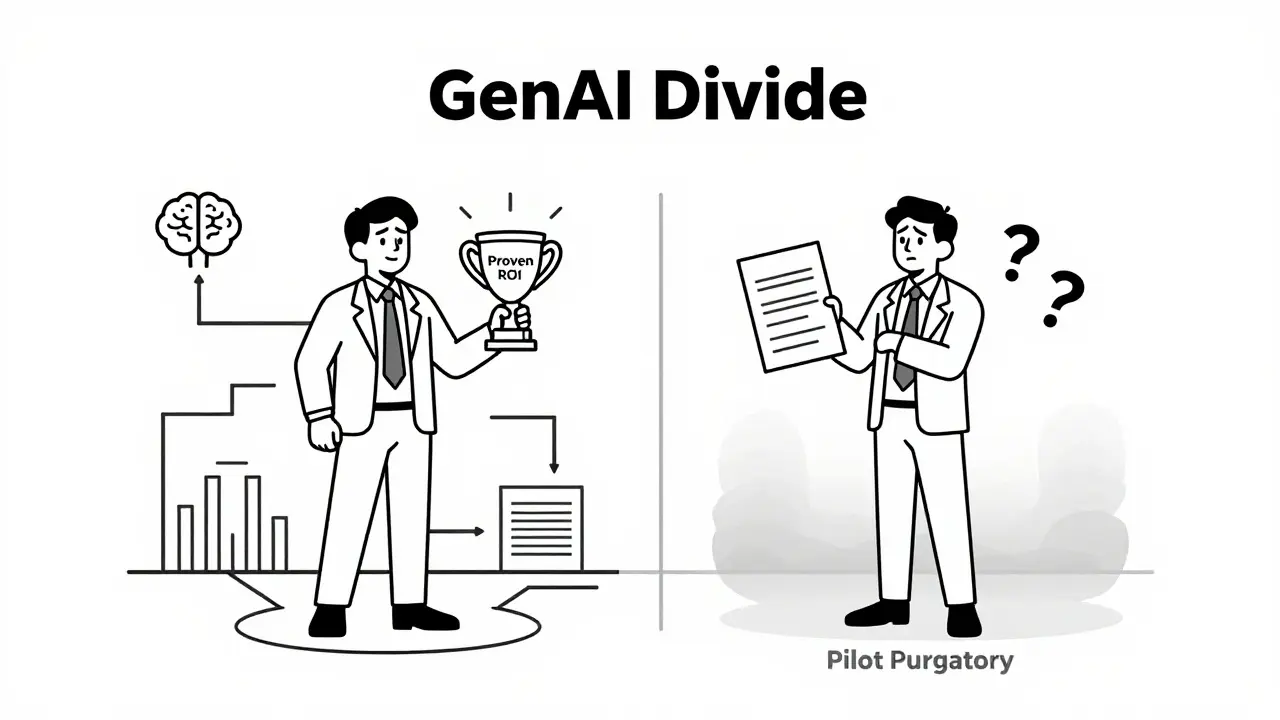
It is May 2026, and the silence in boardrooms is deafening. Companies have spent billions on Generative AI, a technology that promises to revolutionize knowledge work, yet most cannot prove it actually works financially. You are not alone if your CFO is asking for hard numbers while your IT team points to vague "efficiency gains." This disconnect is known as the GenAI Divide, the gap between organizations that can prove ROI and those stuck in pilot purgatory. According to MIT’s 2025 report, 95% of organizations fail to demonstrate measurable financial returns despite massive spending. The problem isn’t that AI doesn’t work; it’s that we are trying to measure a complex, interconnected transformation using outdated, linear tools.
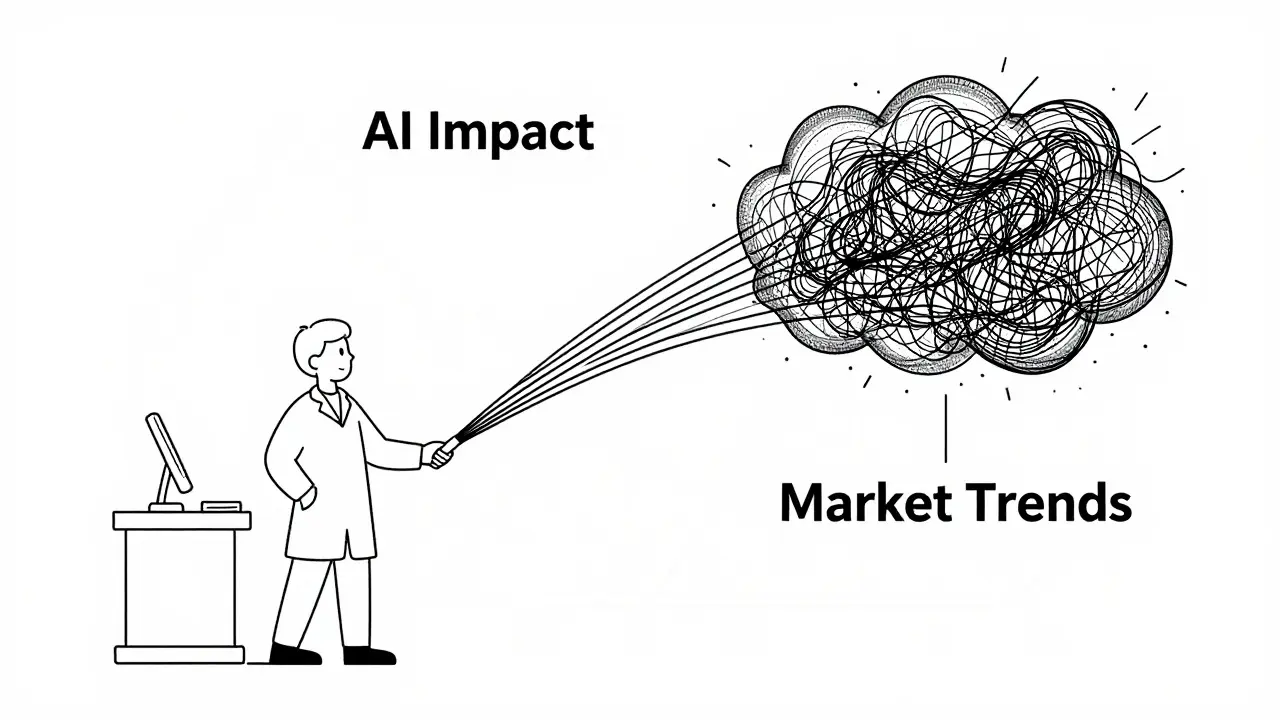
Isolating the specific impact of AI from other changes-like market shifts or process improvements-is the single biggest hurdle facing enterprise leaders today. If you cannot separate the signal from the noise, you risk losing executive support entirely. This guide explains how to move beyond guesswork and implement rigorous attribution models that satisfy even the toughest financial scrutiny.
The Core Problem: Why Traditional ROI Fails for GenAI
Traditional Return on Investment (ROI) frameworks were built for capital equipment or discrete software purchases. You bought a machine, it produced X units faster, and you calculated savings based on labor hours saved. That model breaks down with generative AI because its value is distributed, non-linear, and often invisible in standard metrics.
Generative AI enhances productivity, customer satisfaction, innovation velocity, and risk management simultaneously across multiple departments. When a marketing team uses AI to draft copy, the result isn't just faster writing; it's potentially higher conversion rates, better brand consistency, and reduced agency costs. These benefits ripple through the organization, making it nearly impossible to attribute success to a single source using last-touch attribution methods.
Gartner’s 2024 survey of 1,200 enterprise leaders confirmed this pain point: 74% cite attribution challenges as their primary barrier to proving AI value. Furthermore, 63% of enterprises rely on single-metric ROI calculations, which miss the bigger picture. To fix this, you need to shift from measuring output volume to measuring outcome quality and causal impact.
Technical Barriers to Isolating AI Effects
To accurately measure AI impact, you need data. Lots of it. Organizations attempting to isolate AI effects face a 57% higher data collection burden compared to traditional tech implementations. Deloitte’s 2025 study found that capturing end-to-end impact requires integrating 8-12 disparate systems. Most companies simply don’t have the infrastructure ready.
Here are the three main technical constraints stopping accurate attribution:
- No Control Groups: 68% of data science teams lack proper control groups. Without a baseline group that didn’t use AI, you can’t prove the AI caused the improvement rather than seasonal trends.
- Temporal Misalignment: 42% of organizations assess ROI within 3-6 months. However, generative AI initiatives typically require 12-18 months to mature as users learn and processes adapt. Measuring too early captures the learning curve dip, not the long-term gain.
- Poor Data Lineage: 51% of enterprise data stacks lack the lineage capabilities needed to trace an AI interaction back to a financial outcome. If you can’t link a specific prompt to a closed deal, you can’t attribute value.
Fixing these issues requires building robust data pipelines capable of handling 3-5x more storage than traditional analytics. You also need real-time feedback loops that connect AI outputs directly to business outcomes, rather than relying on monthly retrospective reports.
| Metric / Practice | Successful Organizations (Top 26%) | Struggling Organizations (Bottom 74%) |
|---|---|---|
| Attribution Metrics Used | 3.7x more attribution-specific metrics | Rely on single-metric ROI calculations |
| Baseline Establishment | 92% establish clear baselines before launch | Only 18% set pre-deployment baselines |
| Assessment Window | 12-18 months (allows for maturation) | 3-6 months (captures only initial friction) |
| Control Group Usage | Implement parallel control groups | Rarely use control groups (58% failure rate) |
| Confounding Variables | Account for concurrent process changes | Overlook confounding variables (78% error rate) |
Advanced Attribution Methodologies
If you want to prove ROI, you need to adopt scientific rigor. Leading organizations are moving away from simple before-and-after comparisons toward sophisticated statistical techniques. Kanerika’s 2025 benchmarking study identified three key methods used by the top performers.
Counterfactual Analysis is the gold standard. It asks the question: "What would have happened if we hadn’t deployed AI?" By creating a synthetic control group based on historical data and external factors, you can estimate the counterfactual outcome. Only 22% of enterprises currently use this method, but it provides the highest confidence level. For example, Siemens used counterfactual analysis to isolate a 27% productivity gain from their engineering design assistant, achieving 95% statistical confidence that AI drove the result.
Time-Series Decomposition helps separate AI effects from broader market trends. If your sales increased during an AI rollout, was it the AI or a holiday shopping surge? Time-series decomposition breaks down the data into trend, seasonal, and residual components, allowing you to isolate the specific variance attributable to the AI intervention. This is implemented by only 18% of companies but is critical for industries with strong seasonality.
Causal Inference Techniques, such as difference-in-differences analysis, compare the change in outcomes over time between a treatment group (users with AI) and a control group (users without). This method controls for unobserved variables that affect both groups equally. Mature AI practitioners adopt this approach at a rate of 14%, significantly outperforming peers in credibility with finance teams.
Building the Right Infrastructure
You cannot measure what you do not track. Effective attribution requires a foundational shift in how you handle data. Before deploying any generative AI tool, you should spend 4-6 months establishing measurement infrastructure. Data preparation consumes 58% of the initial effort, so start now.
Your tracking system needs to capture granular usage data-specifically, 15-20 data points per AI interaction. This includes prompt complexity, token usage, user acceptance rates, edit frequency, and downstream actions taken after the AI output. For instance, if an AI generates a code snippet, does the developer copy-paste it directly, or do they modify it extensively? The latter suggests lower value or higher friction.
Furthermore, you must form cross-functional measurement teams. Successful programs include data scientists, business analysts, and domain experts working together. Only 24% of successful initiatives have this structure, yet it is essential for translating technical metrics into business language. A data scientist might see "latency reduction," but a business analyst sees "faster time-to-market for new products."
Practical Steps to Isolate AI Value
Ready to get started? Here is a step-by-step approach to building an attribution framework that withstands scrutiny.
- Define Clear Baselines: Measure current performance metrics before launching the AI pilot. Document everything: average handling time, error rates, employee satisfaction scores, and revenue per hour. Without this snapshot, future comparisons are meaningless.
- Select a Control Group: Identify a comparable group of employees or processes that will not receive the AI tool. Ensure they are similar in skill level, workload, and market conditions. This allows for direct A/B testing.
- Track Multi-Touch Attribution: Map the entire value chain. If AI assists in drafting a proposal, track the lead from generation to final signature. Recognize AI’s role at every stage, not just the initial creation.
- Wait for Maturation: Do not declare victory or defeat at month three. Plan for a 12-18 month assessment window. Acknowledge the "productivity dip" during the learning phase and focus on the long-term trajectory.
- Adjust for Confounders: Actively monitor other changes happening simultaneously, such as website redesigns or pricing updates. Use statistical methods to subtract their estimated impact from the total observed change.
- Combine Hard and Soft ROI: Include tangible financial impacts (hard ROI) like cost savings, but also quantify productivity gains and employee satisfaction (soft ROI). IBM’s 360-degree feedback on AI-assisted developer productivity is a great example of blending qualitative and quantitative data.
Industry Benchmarks and Real-World Examples
Looking at industry leaders can provide concrete targets for your own efforts. American Express measured a 22% reduction in customer service handling time through rigorous A/B testing. They didn’t just claim efficiency; they proved it by comparing AI-assisted agents against a control group under identical conditions.
Unilever achieved a 35% reduction in report generation time using precise time-motion studies. They tracked the exact seconds spent on each step of the reporting process, isolating the time saved by AI automation versus manual input. JPMorgan Chase documented $1.2 million in annual savings from AI-driven document processing by tracking cost reductions from process redesign and risk mitigation outcomes.
Conversely, many failures stem from ignoring context. A senior data scientist at a Fortune 500 company shared on Reddit that they tried to isolate a GenAI chatbot’s impact on sales conversion, only to find that a concurrent website redesign accounted for 82% of the improvement. Had they controlled for the website change, they would have avoided false attribution and potential budget cuts.
The Future of AI Measurement
The landscape is shifting rapidly. Regulatory pressures are intensifying, with the EU AI Act requiring impact assessments that include ROI measurement for high-risk applications. SEC disclosure rules now mandate explanations of AI’s contribution to financial performance for publicly traded companies. This means attribution is no longer just a best practice; it is becoming a compliance requirement.
New tools are emerging to help. Specialized vendors like Censius and WhyLabs offer AI observability platforms that integrate with business intelligence systems. By 2027, Gartner predicts that 60% of large enterprises will require AI initiatives to demonstrate isolated impact through statistically valid methods. The "GenAI Divide" will widen further, separating those who can prove value from those who remain speculative.
To stay ahead, consider implementing "attribution sandboxes"-controlled environments where AI impact can be isolated from other variables. Currently, 34% of enterprises are adopting this approach. These sandboxes allow you to test attribution methodologies before scaling them across the entire organization.
Why is it so hard to measure Generative AI ROI?
Generative AI ROI is difficult to measure because its value is distributed across multiple departments and manifests in non-linear ways. Unlike traditional software that replaces a specific task, AI enhances cognitive work, affecting productivity, innovation, and risk simultaneously. Additionally, concurrent business changes often mask or amplify AI effects, making isolation challenging without rigorous control groups and statistical methods.
What is counterfactual analysis in AI attribution?
Counterfactual analysis is a statistical method used to determine what would have happened in the absence of the AI intervention. By creating a synthetic control group based on historical data and external factors, organizations can estimate the baseline outcome and compare it to the actual results. This helps isolate the specific impact of AI from other variables, providing high-confidence attribution.
How long should I wait before assessing AI ROI?
You should wait 12 to 18 months before fully assessing AI ROI. Early measurements (3-6 months) often capture the learning curve dip, where productivity temporarily decreases as users adapt to new tools. Waiting allows the organization to reach maturity, optimize workflows, and realize the full long-term benefits of the AI implementation.
What data do I need to track for accurate attribution?
Accurate attribution requires granular data, including 15-20 data points per AI interaction. Key metrics include prompt complexity, token usage, user acceptance rates, edit frequency, and downstream business actions. You also need integration across 8-12 disparate systems to connect AI outputs to financial outcomes, along with robust data lineage to trace interactions back to results.
How do I account for confounding variables like market trends?
To account for confounding variables, use time-series decomposition to separate market trends from AI effects. Additionally, employ causal inference techniques like difference-in-differences analysis, which compares changes over time between a treatment group (with AI) and a control group (without AI). This helps isolate the AI’s specific contribution by controlling for external factors that affect both groups.
What is the "GenAI Divide"?
The "GenAI Divide" refers to the growing gap between organizations that can successfully prove the financial value of their generative AI investments (approximately 26%) and those that cannot (74%). This divide is driven by differences in measurement maturity, with leaders using sophisticated attribution models and laggards relying on vague, unverified claims of efficiency.
 Artificial Intelligence