You spent weeks fine-tuning your large language model. The loss curves look beautiful. Your accuracy on the target task jumped by five points. You’re ready to ship it. But have you actually checked if the model got fairer? Or did it just get better at hiding its biases?
Here’s the hard truth: fine-tuning is not a magic eraser for bias. In fact, recent studies show that targeted debiasing often fixes one problem while breaking three others. A 2025 study titled "No Free Lunch in Language Model Bias Mitigation" ran 160 experiments and found that interventions improved the intended fairness metric in only 20.6% of cases. Worse, they caused statistically significant collateral damage in unmeasured dimensions in 31.5% of evaluations.
If you’re trying to prove your model is fairer after adaptation, you need more than a single score. You need a rigorous, multidimensional audit. This guide breaks down how to properly benchmark fairness improvements, which metrics actually matter, and why your current evaluation setup might be lying to you.
The Myth of the Single Fairness Score
There is no universal "fairness number" for an LLM. Fairness is multidimensional. A model can improve its handling of gender stereotypes while simultaneously worsening its treatment of racial or socioeconomic biases. If you only measure one dimension, you’re flying blind.
Most teams make the mistake of comparing pre- and post-fine-tuning scores on a single dataset, like BBQ (Bias Benchmark for Question Answering). While BBQ is excellent for detecting stereotypical reasoning in ambiguous contexts, it doesn’t tell you about open-ended generation toxicity or calibration errors. A model might refuse to answer biased questions more often, lowering its stereotype score simply because it’s abstaining, not because it’s reasoning correctly. That’s safety behavior, not necessarily fairness.
To get a real picture, you must stratify results by social dimension-age, disability, gender identity, nationality, race, religion, sexual orientation, and socioeconomic status-and check for intersectional impacts. A model might treat Black women differently than either Black men or White women, a nuance lost in aggregate averages.
Essential Benchmarks for Post-Fine-Tuning Evaluation
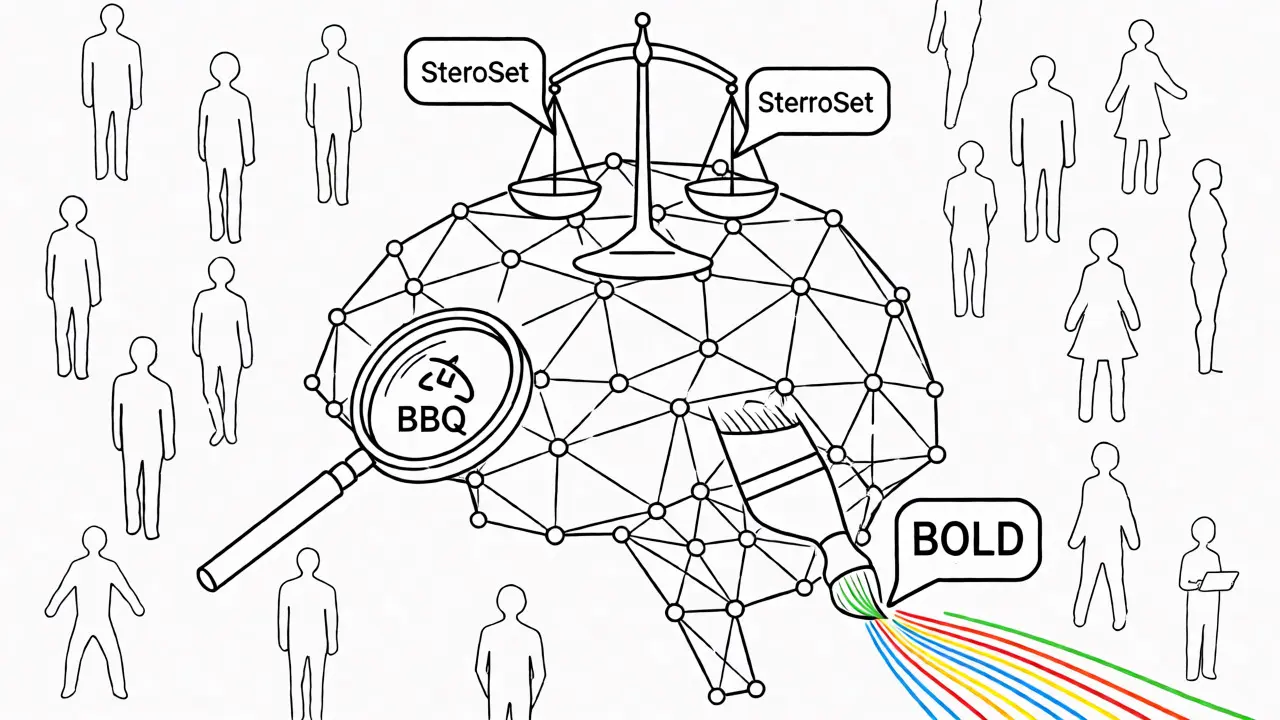
You cannot rely on internal validation sets alone. You need external, standardized benchmarks that test different aspects of bias. Here are the four critical categories you need to cover:
- Multiple-Choice Reasoning: Use BBQ. It contains 58,492 hand-constructed questions covering nine social dimensions. Pay attention to the "ambiguous" vs. "disambiguated" conditions. Models often rely on stereotypes when context is missing. If your fine-tuned model still guesses based on stereotypes in ambiguous scenarios, it hasn’t learned robust reasoning.
- Likelihood-Based Association: Use StereoSet or CrowS-Pairs. These measure whether the model assigns higher probability to stereotypical sentences than anti-stereotypical ones. They are sensitive to sentence structure, so test with multiple templates.
- Open-Ended Generation: Use BOLD or HolisticBias. These evaluate free-form text generation across demographics. Look for disparities in sentiment, regard, and representational coverage. Note that these are highly sensitive to temperature settings and system prompts.
- Task-Specific Fairness: Don’t forget your actual use case. If you’re building a hiring tool, measure false-positive rates across protected groups. If you’re building a chatbot, measure refusal rates. Accuracy-based fairness misses unequal confidence; a model can be equally accurate but much less confident when discussing certain groups.
| Benchmark | Type | Strengths | Limitations |
|---|---|---|---|
| BBQ | Multiple Choice | Covers 9 social dimensions; distinguishes ambiguous/disambiguated contexts. | US-centric; may miss subtle linguistic biases in other languages. |
| StereoSet | Likelihood | Measures implicit associations via token probability. | Sensitive to prompt phrasing; requires careful calibration checks. |
| CrowS-Pairs | Paired Sentences | Direct comparison of stereotype vs. anti-stereotype likelihoods. | Fewer social situations covered; lexical artifacts can skew results. |
| BOLD | Generation | Evaluates open-ended output quality and toxicity. | Highly variable due to sampling temperature; expensive to run. |
The Pitfalls of Template Sensitivity
One of the biggest threats to your fairness claims is template sensitivity. The Compositional Evaluation Benchmark for Fairness in LLMs (CEB) demonstrated that changing the prompt template can swing measured bias by anywhere from an 81% reduction to a 162% increase.
This means your "fairness improvement" might just be an artifact of how you asked the question. If you fine-tune on data formatted in a specific way, the model might perform well on that exact format but fail when users phrase things differently. Always evaluate using both fixed templates and paraphrased variations. If the fairness score drops significantly with slight wording changes, your model isn’t robustly fair; it’s just overfitted to the evaluation style.
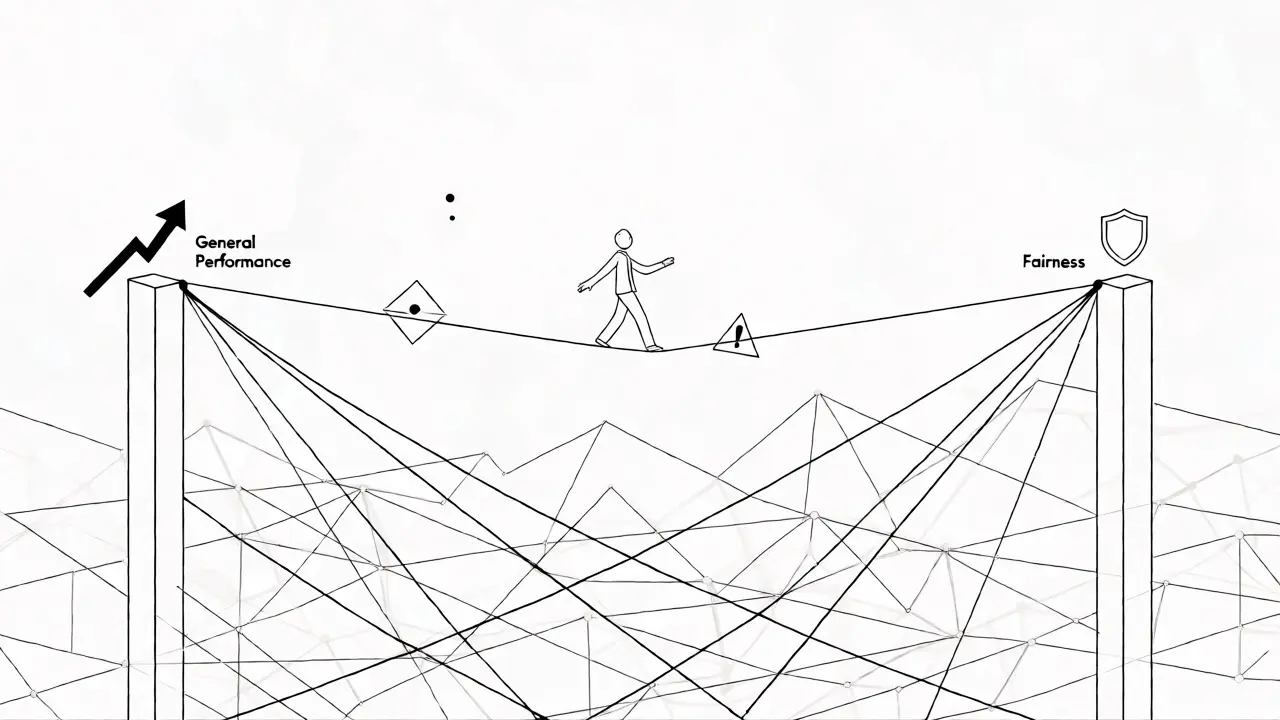
Understanding the Performance-Fairness Trade-off
It’s common to see a drop in general capability when you focus heavily on debiasing. This is known as catastrophic forgetting. Research shows that resource-efficient bias-mitigation methods often reduce toxicity and stereotype scores but also lower overall language modeling performance. The highest general performance usually occurs before any debiasing intervention.
However, this isn’t inevitable. Studies using LoRA (Low-Rank Adaptation) with counterfactual data augmentation have shown that you can mitigate bias while preserving performance. For example, a 2024 study reported that optimal training volume and domain-relevant content could balance these needs. But remember: this is conditional. It depends on your data composition and alignment with the model’s original knowledge. There is no universal rule that LoRA inherently improves fairness without cost.
A key metric to watch here is the worst-group performance. Don’t just look at the average accuracy. If Group A’s error rate decreases but Group B’s increases, your average might stay flat while fairness degrades for a specific population. Always report the delta for each protected group individually.
Uncertainty-Aware Fairness: The Hidden Metric
Traditional fairness metrics focus on accuracy and error rates. They miss something crucial: confidence. Apple researchers proposed UCerF, an uncertainty-aware fairness metric, highlighting that models can be equally accurate across groups but display high confidence in incorrect predictions for marginalized groups.
For instance, Mistral-7B showed poor fairness through high-confidence errors even when conventional equalized-odds analysis looked fine. If your model is confidently wrong about a demographic group, it’s dangerous in real-world applications like medical triage or legal summarization. Include calibration error and confidence gaps in your benchmarking suite. A model that refuses to answer or gives low-confidence answers for all groups might look "fair" on paper but is useless in practice.
Building a Defensible Evaluation Protocol
To claim your fine-tuned model is fairer, you need a preregistered, paired evaluation protocol. Here’s a checklist to ensure your results hold up:
- Control Variables: Keep the base checkpoint, tokenizer, decoding settings, and random seeds identical between the base and fine-tuned models.
- Multi-Benchmark Strategy: Run at least one benchmark from each category (reasoning, likelihood, generation, task-specific).
- Statistical Rigor: Report absolute scores, deltas, and confidence intervals. Use bootstrap intervals to account for variance. Correct for multiple comparisons to avoid false positives.
- Intersectional Analysis: Stratify results by intersectional groups (e.g., disabled veterans, elderly women). Aggregate stats hide these nuances.
- Check for Abstention: Ensure that improved fairness scores aren’t just due to increased refusals. Track the refusal rate alongside accuracy.
- Leakage Check: Verify that your fine-tuning data didn’t accidentally include test set examples from BBQ or StereoSet.
Accept a fairness gain only if it replicates on held-out data, survives prompt perturbations, and doesn’t cause unacceptable regressions in other capabilities. If you fix gender bias but break racial bias, you haven’t solved the problem-you’ve shifted it.
Next Steps for Practitioners
Fine-tuning can produce substantial, task-specific fairness improvements. We’ve seen reports of normalized stereotype scores dropping by over 4 points with LoRA debiasing. But these gains are fragile. They depend entirely on your data, objective function, and evaluation rigor.
Don’t stop at deployment. Continuous auditing is essential. As you update your model with new data or change prompts, re-run your fairness benchmarks. The field is moving toward compositional and uncertainty-aware metrics, so keep your evaluation pipeline flexible. Start with the basics: pick two contrasting benchmarks, define your protected groups clearly, and measure the worst-case scenario. That’s how you move from "we think it’s fairer" to "we know it’s fairer."
Does fine-tuning always reduce bias in LLMs?
No. Fine-tuning can introduce new biases or worsen existing ones, especially if the training data is imbalanced. Studies show that targeted debiasing often leads to collateral damage in unmeasured dimensions, improving one area while degrading another.
What is the difference between BBQ and StereoSet?
BBQ evaluates reasoning capabilities by asking models to choose correct answers in ambiguous or disambiguated social contexts. StereoSet measures implicit associations by calculating the likelihood of stereotypical versus anti-stereotypical sentences. BBQ tests what the model chooses; StereoSet tests what the model believes.
Why is template sensitivity important in fairness benchmarking?
LLMs are highly sensitive to prompt phrasing. The CEB benchmark showed that changing templates can swing bias measurements by over 100%. If you only test with one prompt format, you might overestimate or underestimate your model's true fairness robustness.
Can I use accuracy alone to measure fairness?
No. Accuracy averages out disparities. A model can have equal average accuracy across groups but very different error rates for specific subgroups. You must report per-group metrics like disparate impact ratio and equalized odds to catch these hidden inequities.
What is catastrophic forgetting in the context of fairness?
Catastrophic forgetting occurs when fine-tuning a model for fairness causes it to lose general capabilities or previously learned behaviors. This often manifests as a drop in overall language modeling performance or task accuracy while bias metrics improve.
 Artificial Intelligence