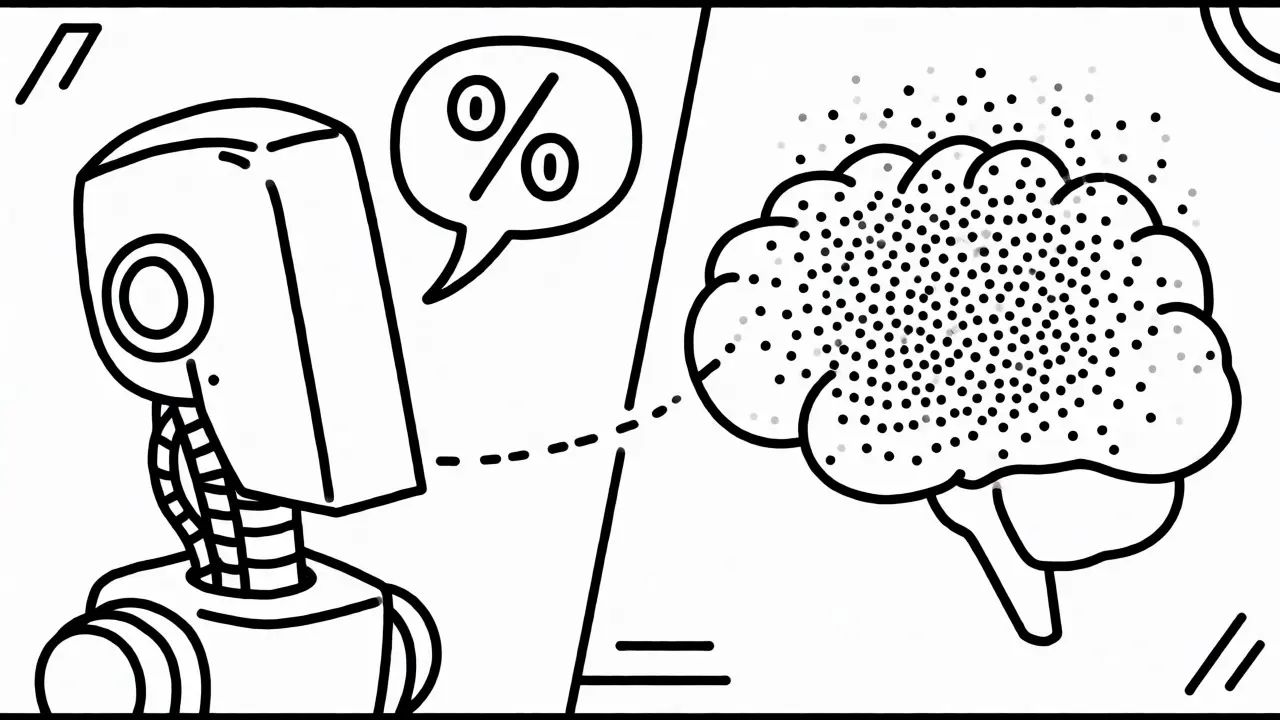
You ask a large language model a question. It answers with absolute certainty. But is it right? Often, the answer is no. This gap between what a model thinks it knows and what it actually knows is called miscalibration. For developers deploying AI in healthcare or finance, this isn't just an academic annoyance; it's a safety hazard. A model that says "I'm 95% sure" but is only 70% accurate can lead to costly mistakes.
Understanding calibration is the key to making these systems trustworthy. It’s not about making the model smarter; it’s about making its confidence scores honest. If a model assigns an 80% probability to a prediction, it should be correct 80% of the time. When that alignment breaks down, you get overconfident hallucinations or underconfident refusals. Let’s look at how to measure this, why it happens, and how to fix it without retraining your entire model.
What Is Model Calibration?
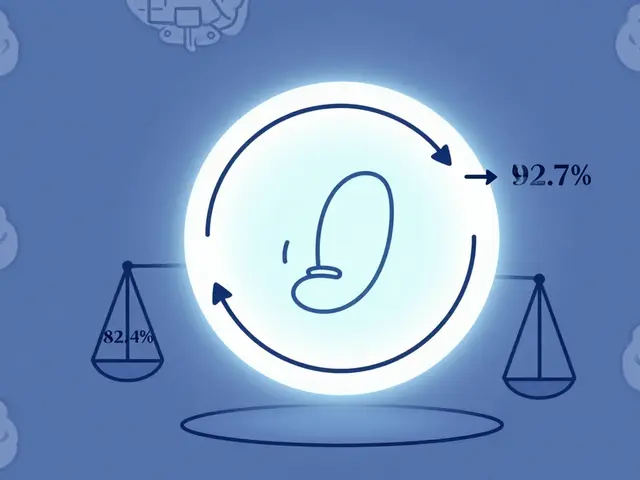
At its core, model calibration refers to the alignment between a model's expressed confidence in its predictions and the actual likelihood of those predictions being correct. Think of it like a weather forecast. If a meteorologist says there’s a 30% chance of rain, and it rains 30 out of every 100 times they say that, their forecasts are calibrated. If it rains 60% of the time when they predict 30%, they’re underconfident. If it rains 10% of the time, they’re overconfident.
In the context of Large Language Models (LLMs), this concept has become critical since the release of GPT-3 in 2020 highlighted the need for reliable uncertainty estimation. Unlike traditional classifiers that output a single probability score, LLMs generate text token by token. Measuring confidence here is trickier because the model doesn’t always provide a clear numerical probability for the final answer. Researchers have found that popular models often exhibit significant miscalibration, especially after undergoing alignment training like RLHF (Reinforcement Learning from Human Feedback).
The tension is real: making a model helpful often makes it less calibrated. Instruction tuning, which teaches models to follow directions and sound human, tends to degrade calibration. Studies show instruction-tuned models can have up to 22.3% worse calibration than their base counterparts. Why? Because these models are trained to be confident and concise, even when they don’t know the answer. They learn to say "I think" or "It is likely" as stylistic choices rather than probabilistic statements.
Key Metrics for Measuring Confidence
You can’t fix what you can’t measure. Several metrics help quantify how well your model’s confidence matches reality. The most common one is Expected Calibration Error (ECE). ECE divides predictions into bins based on confidence levels and calculates the average difference between accuracy and confidence within each bin. A lower ECE means better calibration. Ideally, you want an ECE below 0.1 for production-grade systems. Values above 0.25 usually indicate serious problems, particularly in risk-sensitive applications.
| Metric | What It Measures | Ideal Value | Best Use Case |
|---|---|---|---|
| Expected Calibration Error (ECE) | Average difference between predicted confidence and actual accuracy across all samples. | < 0.1 | General benchmarking and comparison between models. |
| Maximum Calibration Error (MCE) | Worst-case deviation in any single confidence bin. | < 0.25 | Risk-sensitive domains where one bad outlier matters. |
| Brier Score | Mean squared difference between predicted probability and actual outcome (0 or 1). | < 0.2 | Evaluating probabilistic forecasting quality. |
| AUROC | Ability of confidence scores to separate correct from incorrect predictions. | > 0.85 | Assessing discrimination capability, not just calibration. |
Another useful metric is the Brier Score. It measures the mean squared error between the predicted probability and the actual outcome. A perfect prediction gets a score of 0. While ECE tells you if your confidence buckets are off, the Brier Score gives you a holistic view of predictive quality. However, remember that AUROC (Area Under the Receiver Operating Characteristic curve) is different. It checks if high-confidence answers are generally more accurate than low-confidence ones, but it doesn’t tell you if the specific percentage values are meaningful. You might have great AUROC but terrible ECE if your model consistently says "90%" when it should say "60%."

Why LLMs Get Overconfident
It’s frustrating when a model confidently states a false fact. Research points to a few culprits. First, larger models tend to be better calibrated. For instance, LLaMA2-70B showed 15.7% lower ECE than LLaMA2-7B. Scale helps, but it’s not a silver bullet. Second, the data used for training matters. Synthetic data, while cheap and abundant, exacerbates calibration issues by nearly 32% compared to real-world data. Models trained heavily on synthetic datasets learn to mimic patterns without truly understanding uncertainty.
Then there’s the alignment problem. As noted by researchers Zhang et al., instruction tuning deteriorates calibration. When we fine-tune a model to be polite and helpful, we inadvertently teach it to suppress uncertainty. In conversations, saying "I don't know" feels weak. So, models learn to guess confidently. This creates a dangerous scenario in enterprise deployments. Data scientists report that calibration issues cause 37% more false positives in compliance checking than accuracy metrics alone would suggest. Your dashboard looks green, but your legal team is getting flooded with incorrect flags.
Free-form generative tasks are particularly hard to calibrate. Unlike classification, where you pick one label, generation involves complex reasoning chains. Current metrics struggle here. ECE values on free-form tasks are often 42.7% higher than on classification tasks. Chain-of-thought reasoning adds another layer of complexity. Just because a model lists steps doesn’t mean it’s aware of the uncertainty in each step. Critics argue that standard metrics fail to capture the full spectrum of uncertainty in these complex reasoning scenarios.
Practical Techniques to Improve Calibration
You don’t always need to retrain a model to fix calibration. Post-hoc calibration methods can adjust confidence scores after the model generates them. The simplest and most effective method for many cases is temperature scaling. This involves modifying the softmax temperature parameter during inference. By increasing the temperature slightly (typically T=1.2-1.5), you flatten the probability distribution, reducing overconfidence. It requires only a single parameter adjustment and adds near-zero computational overhead. Studies show it improves ECE by 18.2% on average across benchmarks.
If temperature scaling isn’t enough, consider isotonic regression. This non-parametric method fits a monotonic function to map raw confidence scores to calibrated probabilities. It outperforms temperature scaling by about 7.3% in ECE reduction. The catch? It needs a validation set of at least 1,000 samples to avoid overfitting. For teams with limited labeled data, this can be a hurdle. Ensemble methods offer the best results, achieving high accuracy in medical domains, but they cost 3.5× more compute. If latency is critical, ensembles might be too slow.
Newer approaches focus on prompting. The "Credence Calibration Game," published in August 2025, demonstrates that natural language feedback loops can improve calibration without gradient updates. By asking the model to critique its own confidence through iterative prompts, you can achieve a 38.2% ECE reduction. This approach adds about 400ms of latency per request but avoids the need for new weights or extensive validation sets. It’s a promising direction for resource-constrained environments.
Implementation Checklist for Developers
Ready to implement? Here’s a practical path forward. Start small. Don’t try to build a custom calibration pipeline from scratch unless necessary. Most frameworks like Hugging Face have built-in modules rated highly for clarity. Begin by measuring your baseline ECE using a held-out validation set. If it’s above 0.15, apply temperature scaling. Tune the temperature parameter until the reliability diagram-a plot of accuracy vs. confidence-looks diagonal. That’s your goal: a straight line from bottom-left to top-right.
- Measure Baseline: Calculate ECE and MCE on a representative dataset.
- Apply Temperature Scaling: Adjust the softmax temperature (start with T=1.2). Re-measure ECE.
- Validate with Isotonic Regression: If you have >1,000 labeled examples, fit an isotonic regressor. Compare against temperature scaling.
- Monitor in Production: Track confidence distributions over time. Drift in input data can break calibration.
- Set Thresholds: Define action thresholds. For example, if confidence < 0.7, route to human review.
Remember that calibration is domain-specific. Medical LLMs face stricter regulatory scrutiny, with the FDA requiring quantifiable uncertainty metrics for AI-assisted diagnosis tools. Financial services also demand high precision due to the cost of false positives. Tailor your calibration strategy to the stakes involved. A chatbot for customer support might tolerate higher ECE than a diagnostic assistant.
The Future of Trustworthy AI
The industry is moving fast. Google’s Gemma 3 introduced native calibration layers that reduce ECE by 29.4% without extra inference cost. Meta’s Llama-3.2 uses confidence-aware routing to dynamically select calibration methods. These architectural changes signal that calibration is becoming a first-class citizen in model design, not just an afterthought.
Standardization efforts are also underway. The IEEE P3652.1 working group, with over 200 participating organizations, is developing the first industry standard for LLM calibration measurement. This will likely unify how we define and report confidence, making comparisons between vendors easier. Without proper calibration, models face higher regulatory rejection rates. By 2027, Forrester predicts models without robust uncertainty metrics will see 73% higher rejection rates in high-stakes domains.
Ultimately, calibration bridges the gap between capability and trust. Accuracy tells you how often the model is right. Calibration tells you when to believe it. Both are essential. Ignoring confidence scores is like driving with a broken speedometer-you might be going the right speed, but you won’t know if you’re speeding.
What is a good ECE score for an LLM?
Generally, an Expected Calibration Error (ECE) below 0.1 is considered good for most applications. Scores above 0.25 indicate significant miscalibration, which may require intervention before deploying in sensitive contexts like healthcare or finance.
Does temperature scaling change the model's answers?
Temperature scaling primarily affects the probability distribution assigned to tokens, not necessarily the greedy decoding choice. However, if you use sampling strategies (like top-p or top-k), changing the temperature can alter the generated text. For pure calibration of confidence scores without changing the output text, post-hoc scaling on logits is preferred.
Why do instruction-tuned models have worse calibration?
Instruction tuning optimizes models to be helpful and coherent, often encouraging concise and assertive responses. This training process can suppress expressions of uncertainty, leading models to appear more confident than their underlying probability distributions justify. This creates a trade-off between alignment (helpfulness) and calibration (reliability).
Can I calibrate an API-based model like GPT-4?
Yes, but indirectly. Since you don't have access to the raw logits, you must rely on logprobs if provided by the API. You can then apply external calibration techniques like Platt scaling or isotonic regression to these logprob-derived confidence scores. Some newer APIs also allow setting a 'confidence' parameter or returning uncertainty estimates natively.
Is calibration the same as accuracy?
No. Accuracy measures how often the model is correct. Calibration measures whether the model's confidence in its correctness matches its actual accuracy. A model can be highly accurate but poorly calibrated (e.g., always 99% confident) or perfectly calibrated but less accurate (e.g., correctly predicting 70% of answers with 70% confidence).
 Artificial Intelligence