
Why Your LLM Is Failing Silently
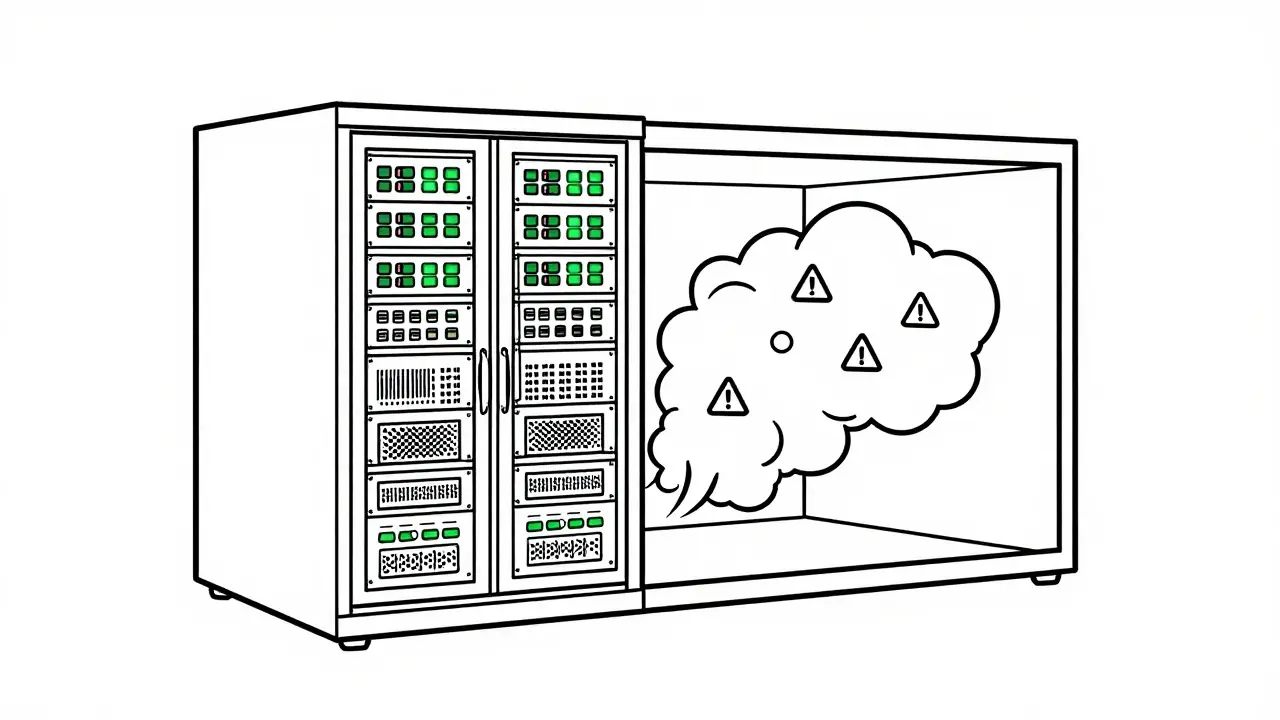
You deployed your large language model. The tests passed. The latency looked good. But three weeks later, customer complaints spike. Response times have doubled, and the answers are getting worse. Yet, your dashboard shows green lights across the board. This is a silent failure, and it is the most dangerous problem in modern AI infrastructure.
Silent failures happen when a service continues to run but delivers degraded performance. In traditional web apps, a server crash sends an immediate alert. In GPU-backed LLM services, the hardware keeps humming, but the quality of inference drops due to thermal throttling, memory leaks, or inefficient resource usage. According to Alibaba Cloud's technical documentation from late 2023, traditional gateway detection mechanisms often respond too slowly to these emerging issues. By the time conventional alerts trigger, business impact has already occurred.
The core issue is that standard monitoring tools look at HTTP status codes and CPU load. They do not see what is happening inside the GPU. A GPU can be running hot, leaking VRAM, or idling while the queue backs up, all without returning a 500 error. To fix this, you need a specialized approach to health checking that looks deeper than the network layer.
The Metrics That Actually Matter
Most engineers start by monitoring CPU and RAM. For LLMs, this is like checking the tire pressure on a car while ignoring the engine temperature. You need to monitor specific GPU metrics to catch silent degradation early. Here are the critical indicators you must track:
- SM Efficiency: Streaming Multiprocessor efficiency measures how effectively the GPU cores are processing data. For optimal LLM inference, target above 70%. If this drops, your model is likely waiting on memory or I/O rather than computing.
- VRAM Utilization: Track Video RAM usage closely. A gradual increase exceeding 5% per hour during steady-state operation usually indicates a memory leak. Unlike CPU memory, VRAM does not get swapped to disk; when it fills up, requests fail silently or hang.
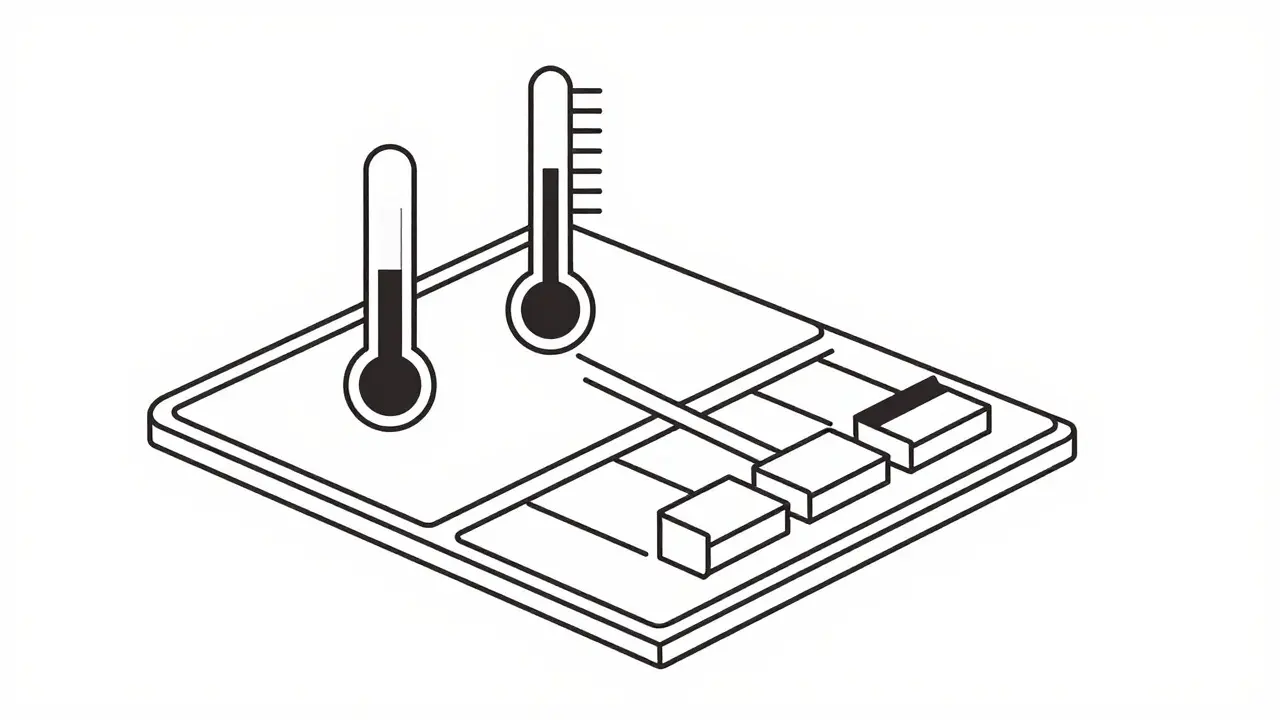
- Thermal Throttling: GPUs reduce clock speeds to protect themselves from overheating. Set alerts at 85°C for high-end cards like the NVIDIA A100. Sustained temperatures above 90°C will cause significant performance drops without crashing the service.
- First Packet Timeout: In streaming LLM responses, the time until the first token arrives is crucial. Alibaba Cloud recommends configuring timeouts around 500ms. If this metric spikes, users perceive the service as broken even if the final response eventually arrives.
Qwak’s 2024 research highlights a counterintuitive finding: relatively high GPU utilization (around 70-80%) is actually ideal for LLM workloads. In traditional CPU environments, 80% utilization might signal overload. In GPU inference, low utilization often means the system is under-provisioned or blocked by bottlenecks elsewhere. Understanding these nuances prevents false alarms and helps you scale correctly.
Choosing Your Monitoring Stack
You have two main paths for implementing these checks: commercial managed platforms or open-source stacks. Each has trade-offs in cost, complexity, and capability.
| Feature | Commercial (e.g., Datadog) | Open Source (LGTM + DCGM) |
|---|---|---|
| Cost | $0.25 per 1,000 inference requests | $0.05-$0.10 per 1,000 requests (self-managed) |
| Setup Time | Days (agent install) | Weeks (configuration & tuning) |
| GPU Specificity | Good (pre-built dashboards) | Excellent (customizable via DCGM exporter) |
| Maintenance | Low (vendor managed) | High (requires DevOps expertise) |
| Alert Fatigue Risk | Medium (needs careful config) | High (without strict filtering) |
Datadog leads the commercial space with strong correlation between infrastructure metrics and business KPIs. Their ML monitoring module helps map dependencies and establish baselines quickly. However, the cost adds up fast as traffic scales. On the other hand, the LGTM stack (Loki, Grafana, Tempo, Mimir) combined with the NVIDIA DCGM exporter offers superior customization. TechStrong.ai documented cases where this combination allowed teams to visualize thermal throttling and power metrics in real-time, catching issues that generic APM tools missed.
If you choose the open-source route, avoid the trap of collecting every metric available. The NVIDIA DCGM exporter exposes over 200 metrics. Most are noise. Filter down to the 15-20 most critical ones for your specific workload. As Dr. Sarah Johnson from Stanford AI Lab cautioned in her 2024 paper, over-monitoring leads to alert fatigue. Aim for a Minimum Viable Observability (MVO) setup that delivers immediate value without drowning your team in notifications.
Implementing Active and Passive Checks
Health checks fall into two categories: active and passive. Relying on just one leaves gaps in your defense.
Passive health checks monitor the traffic that is already flowing through your system. They look at error rates, latency percentiles, and throughput. Envoy proxies and AWS ALBs typically use only passive checks. The downside is delay. If traffic drops because users leave the site, passive checks might not detect the underlying GPU issue until new traffic hits and fails.
Active health checks send synthetic requests to your service to verify its state. Alibaba Cloud’s Higress gateway supports both types simultaneously. It uses active probes to keep nodes warm and detect startup issues, while passive checks monitor live user traffic. This dual approach provides a stronger safety net. For example, if an active check detects a slow response due to thermal throttling, the gateway can mark the node as faulty and eject it before real users are affected.
To implement this effectively, configure your detection interval tightly. Alibaba Cloud suggests a 1-second detection interval for LLM services. Set a base ejection time of 30 seconds to prevent flapping (where a node is repeatedly added and removed from the pool). Also, define clear thresholds. If the request failure rate reaches 50%, remove the node immediately. Do not wait for 100% failure.
Real-World Pitfalls and Fixes
Even with the right tools, implementation mistakes are common. Here are three scenarios based on real-world reports from engineering teams:
- The Memory Leak Surprise: A financial services firm lost $1.2 million in trading opportunities because their LLM analysis system had a subtle VRAM leak. The GPU didn't crash; it just got slower as memory filled up. Fix: Implement automated baseline detection. If VRAM usage drifts upward by more than 5% per hour during steady state, trigger an alert and restart the container.
- The Thermal Throttle Trap: An e-commerce company saw response times jump from 800ms to 2200ms during a sale event. No errors were logged. The issue was inadequate cooling in their data center rack causing GPUs to throttle. Fix: Monitor out-of-band telemetry. Use sensors that report temperature independently of the GPU driver to catch environmental issues before they impact compute.
- The Idle GPU Mystery: A startup spun up expensive A100 instances but saw low utilization. They thought they needed more GPUs. In reality, the bottleneck was in the pre-processing step feeding data to the model. Fix: Correlate GPU utilization with upstream service latency. Low GPU usage combined with high queue depth points to a bottleneck outside the GPU itself.
Dr. Alex Smolyansky, CTO of Qwak, emphasizes that LLM monitoring requires understanding the individual impact of each use case on CPU, GPU, and memory. Generic dashboards won't cut it. You need context-aware alerts that distinguish between a busy period and a failing component.
Next Steps for Your Infrastructure
Start small. Pick your most critical LLM service. Define its Service Level Objectives (SLOs). Map its dependencies. Then, deploy the NVIDIA DCGM exporter if you haven't already. Connect it to Prometheus or your preferred metrics collector. Focus on SM efficiency, VRAM trends, and thermal limits first. Once those are stable, expand to include first-packet latency and end-to-end trace correlation.
Remember, the goal is not just to detect failures but to prevent them. By catching silent degradation early, you maintain trust with your users and optimize your cloud spend. As the EU AI Act enforcement deadline approaches in mid-2025, continuous monitoring of high-risk AI systems will become a regulatory requirement, not just a best practice. Get ahead of the curve now.
What is a silent failure in an LLM service?
A silent failure occurs when an LLM service continues to run and return HTTP 200 OK responses, but the quality of the output degrades or latency increases significantly. This is often caused by GPU thermal throttling, memory leaks, or inefficient scheduling, which standard web monitors miss because they only check connectivity, not performance internals.
Which GPU metrics are most important for LLM health checks?
The most critical metrics are SM Efficiency (target >70%), VRAM utilization trends (watch for >5% hourly growth indicating leaks), and thermal temperatures (alert at 85°C+). Additionally, monitor First Packet Timeout (aim for <500ms) to ensure responsive streaming experiences.
Should I use Datadog or open-source tools for LLM monitoring?
Choose Datadog if you want quick setup, low maintenance, and deep integration with business KPIs, despite higher costs ($0.25/1k requests). Choose open-source stacks like LGTM + NVIDIA DCGM if you have DevOps expertise, need granular control over GPU-specific metrics, and want to minimize per-request costs.
How do I prevent alert fatigue when monitoring GPUs?
Adopt a Minimum Viable Observability (MVO) approach. Instead of collecting all 200+ metrics from NVIDIA DCGM, filter down to the 15-20 metrics that directly impact your SLOs. Set intelligent thresholds based on baselines rather than static numbers, and correlate infrastructure alerts with actual user-facing errors.
What is the difference between active and passive health checks for LLMs?
Passive health checks monitor existing user traffic for errors and latency spikes. Active health checks send synthetic requests to test the service's responsiveness regardless of user traffic. Using both ensures you detect issues even during low-traffic periods or before users encounter them.
 Artificial Intelligence



Chandan Singh
August 2, 2026 AT 13:06Let's be real, most of you are overcomplicating this because you didn't read the NVIDIA documentation properly. SM efficiency is not just a number, it's a symptom of poor kernel launch configuration or memory bandwidth saturation. If your SM efficiency is below 70%, check if you're actually feeding the GPU enough work or if you're bottlenecked on PCIe transfer speeds. Also, VRAM leaks in PyTorch are usually due to not clearing caches or holding onto tensors in global scope. It's basic garbage collection logic that everyone forgets. Don't blame the hardware when your code is sloppy.
Joanna Mucha
August 3, 2026 AT 17:00The tragedy of modern engineering is that we have built cathedrals of silicon only to watch them rot from the inside out while we stare at green lights like obedient sheep.
We monitor the pulse but ignore the soul of the machine. The GPU does not care about your HTTP status codes; it cares about heat, entropy, and the fleeting dance of electrons. When the thermal throttling begins, it is not merely a technical failure but a metaphor for our collective inability to sustain intensity without burning out. We seek optimization yet embrace stagnation. The silent failure is the scream of the void that we choose to mute because it disrupts our quarterly reports. How poignant that we can predict language but cannot predict our own infrastructure's demise.
Kim Edwards
August 5, 2026 AT 07:54I literally cried when I saw my latency spike during Black Friday last year.
My boss was screaming, the fans were sounding like jet engines taking off, and I was just sitting there watching the temperature hit 92 degrees while the customers got nothing but spinning wheels. It was a nightmare. A total disaster. I thought my career was over. Then I realized it was just thermal throttling and I could have prevented it with a simple alert. The pain was excruciating. I still wake up sweating thinking about those dropped requests. Please don't let this happen to you. It hurts more than you know.
Bonnie Watt
August 5, 2026 AT 19:56You people are all missing the point because you're too busy worshipping these fancy metrics. Who needs DCGM exporters when you have common sense? Most of these 'silent failures' are just bad coding practices disguised as infrastructure problems. You're spending thousands on monitoring tools instead of hiring competent engineers who know how to write efficient code. It's pathetic really. The industry is bloated with consultants selling fear instead of solutions. Stop buying into the hype and start debugging your actual applications. Your GPUs aren't failing, your mindset is.
Meagan Mueller
August 7, 2026 AT 15:26they want you to think its just heat and memory leaks but its deeper than that
the big cloud providers are intentionally throttling your instances to force you into higher tiers or their managed services where they take a bigger cut. look at the timing of these 'best practices' always aligning with new pricing models. alibaba and aws are playing chess while you're playing checkers with your alerts. the silent failure is a feature not a bug designed to keep you dependent on their black box solutions. trust no one especially not the dashboards they sell you