
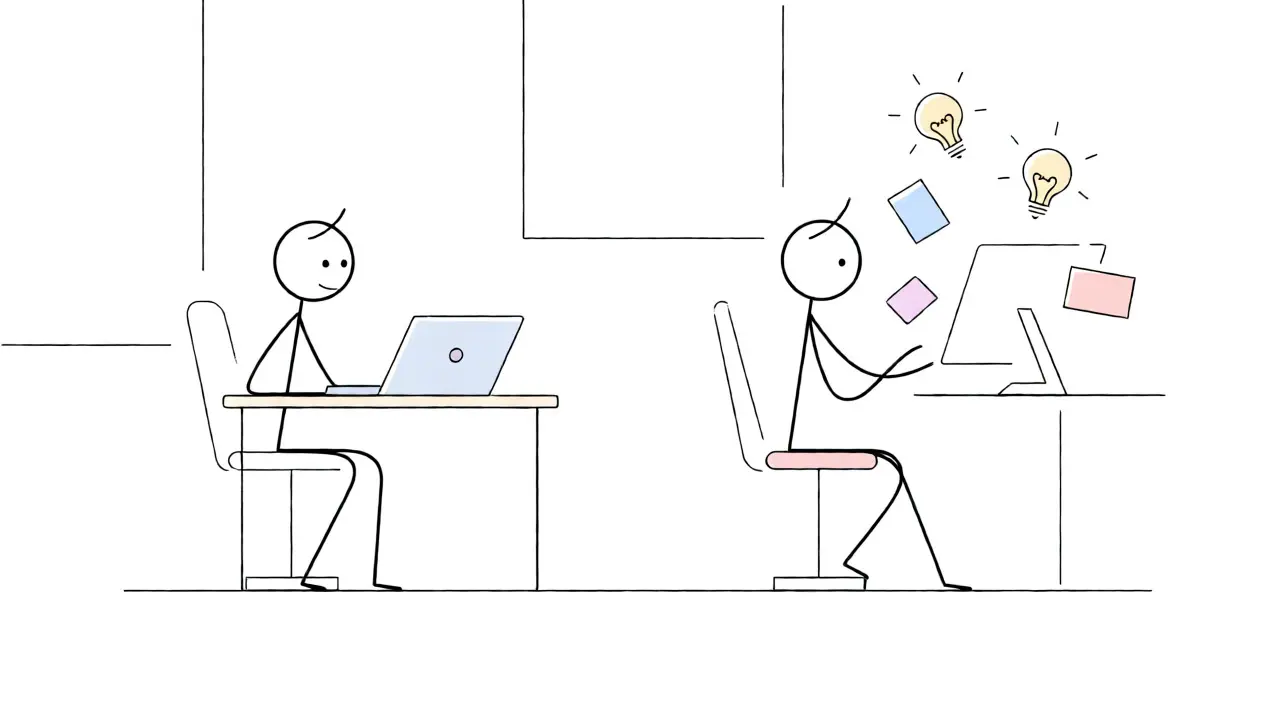
You bought the licenses. You ran the training sessions. Now everyone has access to Generative AI. But do they actually use it? And if they do, is it making them faster, better, or just busier?
This is the billion-dollar question keeping CTOs and HR leaders up at night in 2026. We are past the hype cycle of "will we adopt AI?" and firmly in the phase of "did it work?" Measuring this isn't just about counting logins. It requires a blend of hard data from software logs, soft data from human feedback, and concrete financial outcomes. If you rely on just one method, you’re flying blind.
Why One Metric Isn’t Enough
Most organizations make the mistake of looking at a single dashboard. They see that 80% of employees have logged into Microsoft Copilot or ChatGPT Enterprise and call it a success. But logging in doesn’t mean value creation. A developer might open an AI tool, stare at the prompt box for ten seconds, close it, and go back to coding manually. That’s adoption without impact.
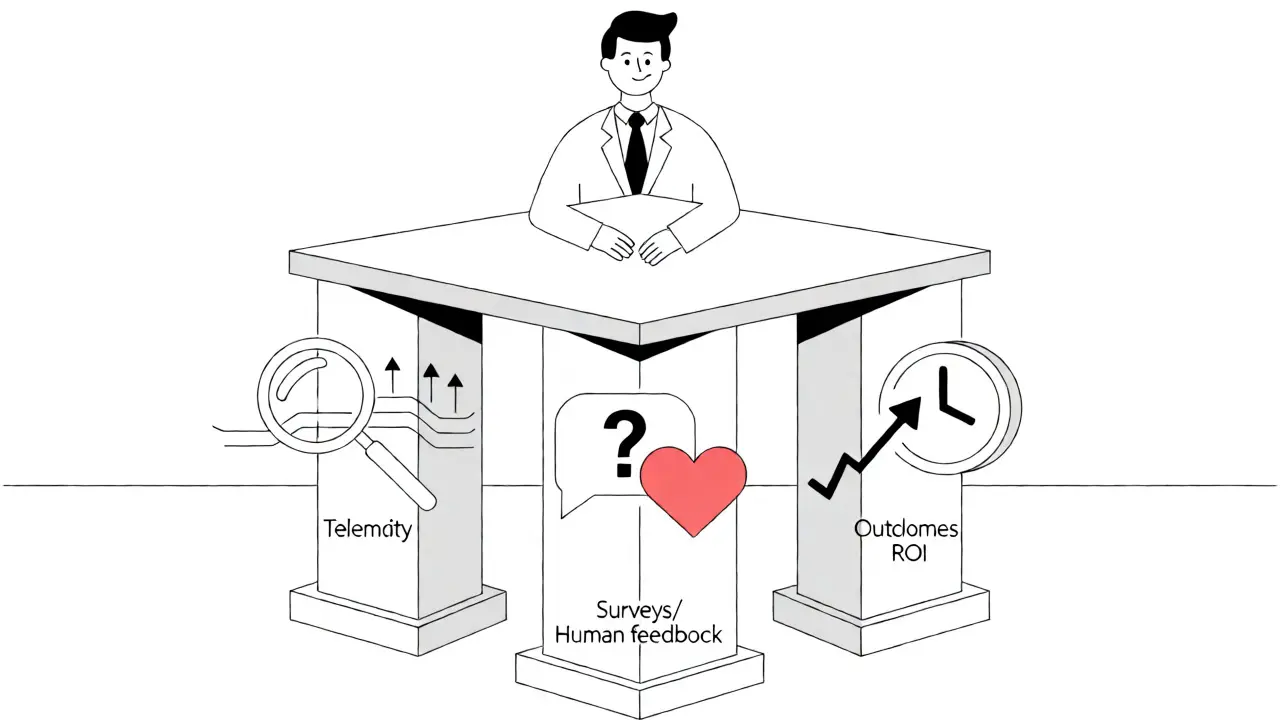
To get the real picture, you need three distinct lenses. Think of them as a tripod. Remove one leg, and your analysis falls over.
- Telemetry: The raw, objective data from the tools themselves. Did they click? How many times? What did they type?
- Surveys: The subjective human experience. Do they trust the output? Do they feel more productive?
- Outcomes (Experience Sampling): The actual business result. Did this save two hours? Did it reduce bugs by 15%?
Each method fills the gaps left by the others. Telemetry tells you what happened but not why. Surveys tell you how people feel but often suffer from bias. Outcomes tell you the value but are hard to scale. Together, they give you the truth.
Telemetry: The Hard Truth from Logs
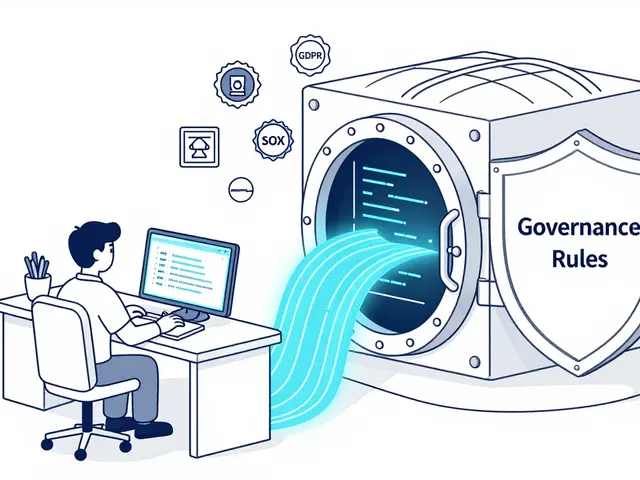
Telemetry is the most immediate way to track adoption because it happens automatically. No forms to fill out, no memory lapses. Platforms like GitHub, Microsoft 365, and Worklytics capture every keystroke and interaction.
For engineering teams, the metrics are specific. You aren’t just looking at "active users." You’re looking at acceptance rates. If an AI suggests code and the developer accepts it, that’s a signal. If they ignore it, that’s another. LinearB, a popular framework for measuring developer productivity, tracks daily active users, lines of code suggested, and the ratio of accepted versus rejected suggestions. This tells you if the tool is helpful or noisy.
For general knowledge workers, the data looks different. Worklytics integrates with Microsoft 365 to track prompts across Word, Excel, and Outlook. They’ve found that beginner teams typically generate 15-30 prompts per employee per month. If your team is averaging five, they aren’t really using it. If they’re hitting 100+, they’re likely automating significant workflows.
However, telemetry has a dirty secret: it lacks context. A high number of prompts could mean deep engagement, or it could mean frustration-users trying again and again because the first ten answers were wrong. Data cleaning is critical here. You need to normalize signals to ensure you aren’t counting accidental clicks as meaningful interactions.
Surveys: Capturing the Human Side
If telemetry shows you the "what," surveys reveal the "why." Why did developers reject those AI suggestions? Was it hallucination? Lack of trust? Or just bad timing? Surveys allow you to ask these questions directly.
The Harvard Project on Workforce launched the Generative AI Adoption Tracker to measure exactly this. Their research highlights a crucial lesson: how you ask matters. In their August 2024 survey, initial results showed 39.4% of the population used GenAI. After revising the question sequencing to be less intimidating, the number jumped to 44.6%. Same time period, same people, different framing.
This demonstrates that self-reported adoption is sensitive to design. When building your internal surveys, avoid vague questions like "Do you use AI?" Instead, ask about specific tasks. "Did you use AI to draft emails this week?" yields more accurate data than broad statements.
Surveys also help identify barriers. Are employees afraid of being replaced? Do they find the tools distracting? Qualitative feedback here is gold. It helps you tailor training programs. If 40% of your staff says they don’t know how to write good prompts, you don’t need more licenses; you need a workshop.
| Method | Primary Insight | Data Source | Key Limitation |
|---|---|---|---|
| Telemetry | Usage frequency & intensity | Software logs (APIs) | Lacks context on quality/trust |
| Surveys | Satisfaction & perceived productivity | Employee responses | Self-reporting bias |
| Experience Sampling | Actual time/cost savings (ROI) | Task-specific tracking | High participant effort |
Outcomes: Calculating Real ROI
Here is where most companies fail. They stop at adoption rates. Executives want to know the return on investment. This requires experience sampling, a method where you track specific tasks before and after AI implementation.
GetDX, a leader in digital experience research, advocates for this approach. Instead of asking "Are you faster?", you measure the minutes saved on a specific task, like writing unit tests or summarizing meeting notes. Then, you extrapolate that across the organization.
For example, if a developer saves 30 minutes a day using AI for code reviews, and you have 100 developers, that’s 50 hours saved daily. Multiply by hourly wage, and you have a tangible dollar figure. This bridges the gap between abstract usage metrics and concrete business value.
Attribution is tricky, though. Did productivity improve because of AI, or because the team hired a new senior engineer? To isolate the AI effect, you need multivariate analysis. Compare teams with similar profiles-one using AI heavily, one lightly-and look for deltas in key performance indicators like cycle time or bug rates.
Benchmarks: Where Does Your Org Stand?
You might wonder, "Is 40% adoption good?" Context matters. According to the Federal Reserve’s April 2026 monitoring report, citing the Real-Time Population Survey, approximately 41% of U.S. adults reported using generative AI for work-related purposes as of late 2025. This means mainstream adoption is roughly halfway there.
However, workplace adoption varies wildly by industry and role. Technical roles show higher penetration. Microsoft Research notes that while 23% of all U.S. adults have used ChatGPT specifically, workplace-focused surveys show higher numbers for broader GenAI tools. This discrepancy exists because many people use personal accounts at home, which corporate telemetry misses.
Geography plays a huge role too. Microsoft’s population-normalized metrics show strong correlations between national wealth and AI adoption rates. Developed nations with high device penetration and internet infrastructure lead the pack. If you’re comparing your Bellingham-based startup to a firm in San Francisco or New York, expect differences based on local talent pools and tech culture.
Building Your Measurement Framework
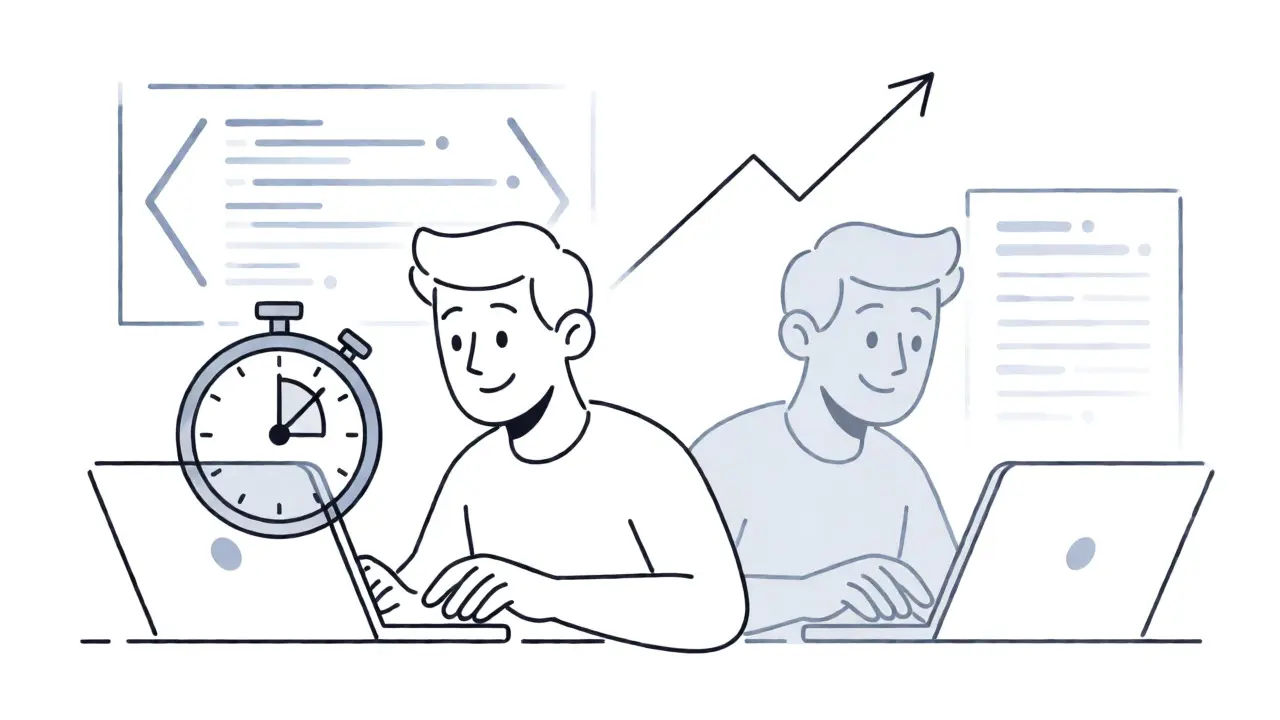
So, how do you put this together? Don’t try to boil the ocean. Start small.
- Establish Baselines: Before rolling out new tools, record current productivity metrics. Cycle time, error rates, and customer satisfaction scores.
- Automate Telemetry: Use platforms like Worklytics or native analytics from Microsoft/Google to pull usage data automatically. Set alerts for drops in engagement.
- Pulse Surveys: Send short, frequent surveys rather than long annual ones. Ask about trust and specific blockers.
- Sample High-Value Tasks: Pick three critical workflows (e.g., coding, copywriting, data analysis) and run time-study experiments to quantify time savings.
Integration is key. Your HR team shouldn’t be emailing spreadsheets to IT. You need a unified dashboard where leadership can see login rates alongside revenue-per-employee trends. Faros.ai distinguishes between "adoption" (spread) and "usage" (depth). Your goal is high depth, not just wide spread.
Common Pitfalls to Avoid
First, beware of the "novelty spike." Usage often jumps when a tool is new, then dips. Track trends over six months, not just the first week. Second, watch out for social desirability bias in surveys. Employees may overstate usage to appear tech-savvy. Cross-reference their claims with telemetry logs. If someone says they use AI daily but their logs show zero prompts, investigate.
Finally, don’t ignore the negative space. Who isn’t using it? Why? Is it a training issue, a tool compatibility issue, or resistance to change? Identifying non-users is just as important as tracking power users.
Frequently Asked Questions
What is the difference between adoption and usage?
Adoption refers to the breadth of deployment-how many employees have access to or have started using the tool. Usage refers to the depth and frequency-how intensely and effectively they are using it. A company can have 100% adoption but low usage if employees only use the tool occasionally or superficially.
How accurate are self-reported productivity gains in surveys?
Self-reported gains are often inflated due to social desirability bias or optimism. Employees may believe they are more productive because they feel empowered by the tool. For accurate ROI calculation, combine survey data with objective telemetry or time-motion studies (experience sampling) to validate claims.
What is a good benchmark for AI prompt frequency?
According to Worklytics data, beginner teams typically average 15-30 prompts per employee per month. Advanced teams integrating AI into core workflows may exceed 100 prompts monthly. Benchmarks vary significantly by role, so compare against internal historical data or industry peers rather than global averages.
Can telemetry alone prove ROI?
No. Telemetry shows activity, not value. High usage does not guarantee positive outcomes; users might be struggling with poor outputs. To prove ROI, you must link usage data to business outcomes like reduced cycle time, lower error rates, or increased revenue, often requiring additional outcome-based measurement methods.
How does survey design affect reported adoption rates?
Survey design significantly impacts results. Harvard research showed that changing question sequencing increased reported GenAI usage from 39.4% to 44.6% in the same population. Framing questions around specific tasks rather than general awareness yields more accurate and actionable data.
 Artificial Intelligence


Vishnu Vardhan Reddy M S
September 7, 2026 AT 02:35Oh, fantastic. Another article telling us that counting logins is the peak of our analytical capabilities.
We’ve been doing this for decades in enterprise software. Telemetry without context is just noise with a price tag. It’s adorable how we keep rediscovering basic data science principles every time a new shiny tool drops.
The part about survey bias is spot on though. People lie to themselves before they lie to you.
If your dashboard doesn’t correlate usage with actual output deltas, you’re not measuring ROI. You’re measuring vanity.
Kyle Ware
September 7, 2026 AT 15:48Agreed Vishnu
One thing I’d add is the importance of baselines
You can’t measure lift if you don’t know where you started
We usually run a two week observation period before rolling out any AI tools to get clean pre-adoption metrics
This makes the post rollout comparison much more credible
Also worth noting that telemetry needs to be normalized for role types
A developer’s prompt frequency looks very different from a marketing manager’s
Comparing them directly creates false negatives for non technical roles
Tamara Miller
September 7, 2026 AT 16:29Finally someone said it!!
It is SO frustrating when managers think "active users" equals "productive employees."
I have seen teams where everyone logs in because HR sends annoying reminder emails... but then they close the tab immediately after opening it!
It's lazy management!!!
They want easy numbers so they ignore the hard truth.
And don't even get me started on those surveys... people just click whatever gets them off their screen fastest.
We need real accountability, not these fluffy engagement metrics that mean absolutely nothing.
Companies are wasting millions on licenses nobody uses properly... and nobody wants to admit it because it reflects poorly on their training programs.
Onyinyechi Nwosu
September 8, 2026 AT 19:48this hits home
we tried tracking ai usage last quarter and the data was so messy
half the team used personal accounts so our corporate logs showed zero activity
it felt like we were chasing ghosts
the point about experience sampling is good though
seeing actual time saved on specific tasks made more sense than guessing based on clicks
maybe we should have focused less on who logged in and more on what got done faster
Susan Cole
September 9, 2026 AT 11:48I appreciate the balanced view here.
It’s important to remember that not every employee will adopt new tools at the same pace or intensity.
Pushing too hard for uniform adoption rates can create unnecessary stress for staff who prefer traditional workflows.
Perhaps the focus should shift from forcing usage to identifying natural champions within teams who can mentor others organically.
This might lead to more sustainable integration than top-down mandates alone.
Iva Grekova
September 11, 2026 AT 02:12love this breakdown especially the tripod analogy
it’s so true that relying on one metric leaves you blind
i’ve noticed that when i combine my own usage logs with how i actually feel after using the tools i get a much clearer picture
sometimes high usage means i’m struggling with the output rather than succeeding
glad to see others thinking about this holistically too