
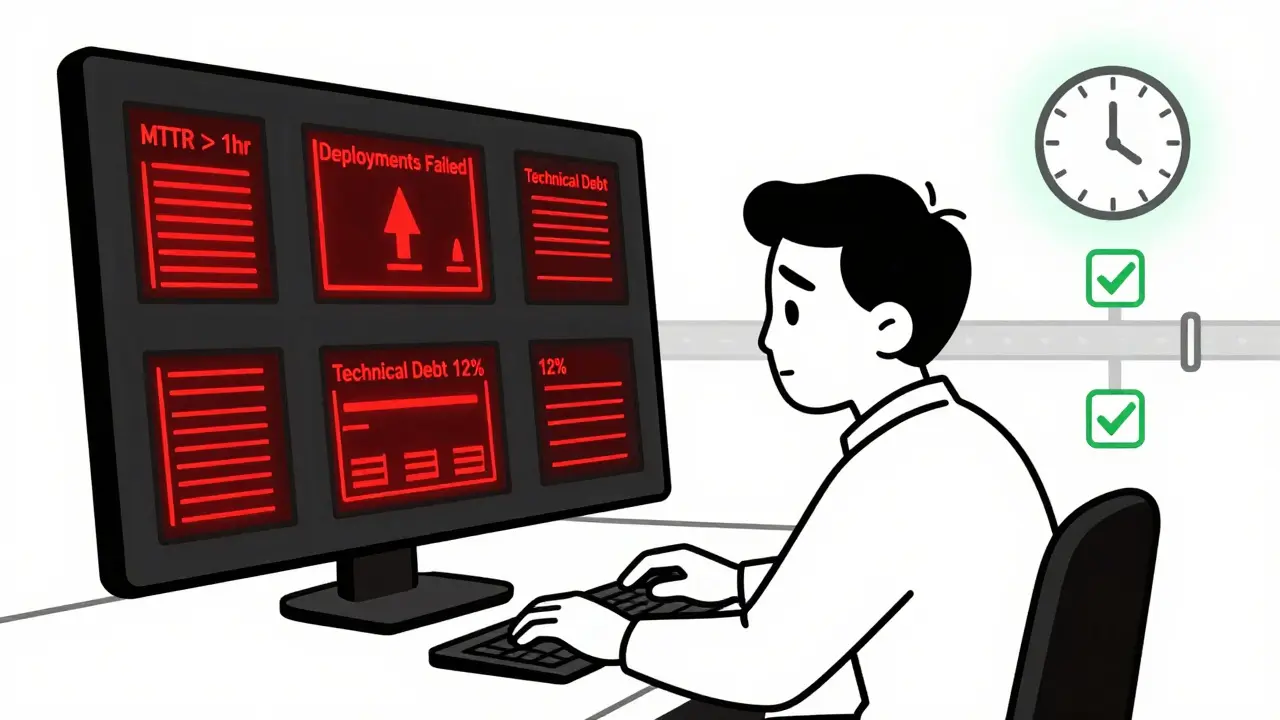
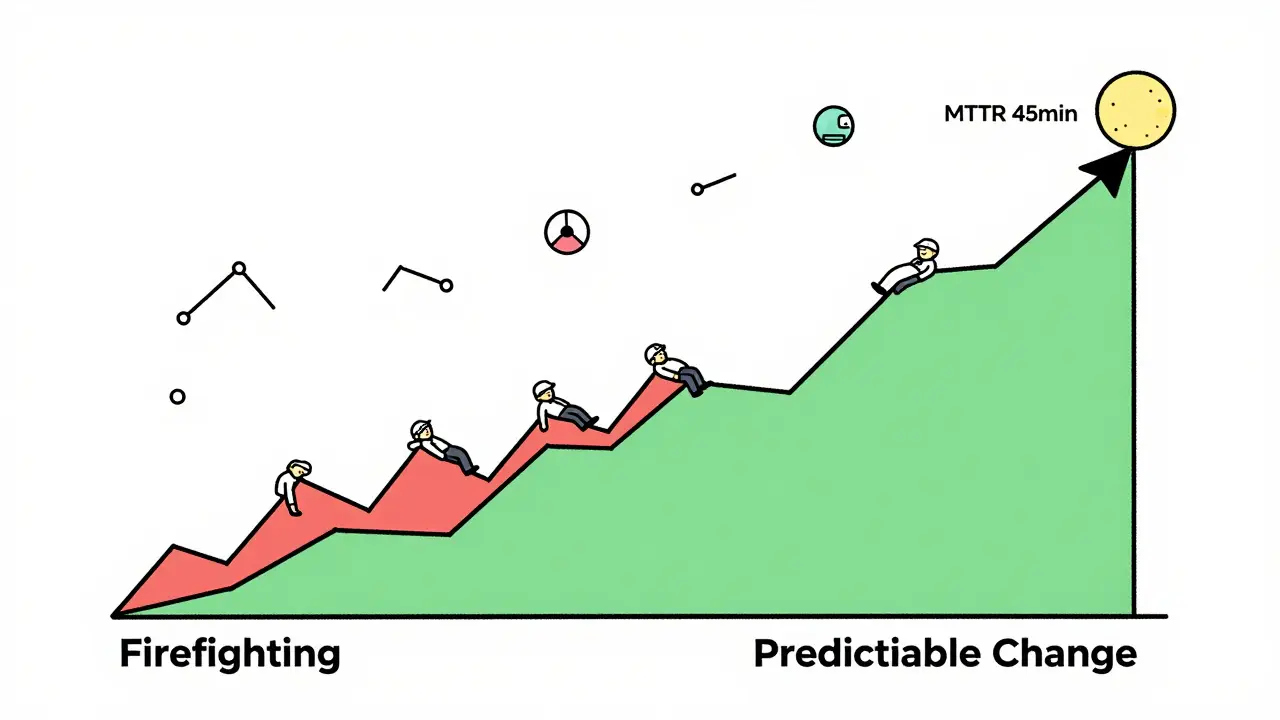
Most teams measure uptime, latency, and error rates. But what happens when your system is stable today but impossible to change tomorrow? That’s the hidden cost of ignoring maintainability. If your engineers spend half their time fixing the same bugs, waiting for builds, or rolling back bad deploys, you’re not just slow-you’re at risk of collapse. Maintainability SLOs aren’t about making code pretty. They’re about making change predictable, safe, and fast. And if you’re not measuring them, you’re flying blind.
What Are Maintainability SLOs, Really?
Service Level Objectives (SLOs) for maintainability track how easy it is to update, fix, and improve your software. Unlike traditional SLOs that ask, "Is the site up?"-these ask, "Can we ship a fix in an hour? Can we deploy ten times a day without breaking things?" They turn vague complaints like "Our codebase is a mess" into concrete targets you can act on.
Google’s SRE team started using these ideas back in the early 2000s, but most companies only began adopting them seriously after 2020. The data doesn’t lie: teams with formal maintainability SLOs resolve incidents 47% faster and ship features 35% quicker than those without. Yet, only 32% of organizations have them in place-even though 78% say they’re important. Why? Because setting them up feels messy. You need to connect your CI/CD pipeline, version control, and incident tools. Most teams don’t know where to start.
The Five Core SLIs for Maintainability
Not all metrics matter. Some look good on a dashboard but don’t reflect real engineering pain. Here are the five SLIs (Service Level Indicators) that actually predict maintainability:
- Mean Time to Recovery (MTTR) - How long does it take to fix a production issue? Target: under 1 hour. If it’s over 2 hours, you’re firefighting, not building.
- Change Failure Rate - What percentage of deployments cause an incident? Target: under 10%. A rate above 15% means your testing or deployment process is broken.
- Deployment Frequency - How often do you ship code? Target: at least 15 times per week. Teams that deploy daily fix bugs faster and have fewer major outages.
- Lead Time for Changes - From code commit to production. Target: under 2 business days. If it takes a week, your pipeline is clogged with manual steps.
- Technical Debt Ratio - The percentage of code that’s flagged as high-risk (complex, untested, duplicated). Target: under 5%. This isn’t about lines of code-it’s about risk exposure.
These aren’t theoretical. A Fortune 500 company cut critical bug recurrence by 63% after setting an SLO: "85% of hotfixes must address root causes, not symptoms." That’s the difference between patching leaks and fixing the pipe.
How to Set Alerts That Don’t Drive Engineers Crazy
Alerts are the heartbeat of SLOs. But bad alerts cause alert fatigue. Good alerts trigger action-not panic.
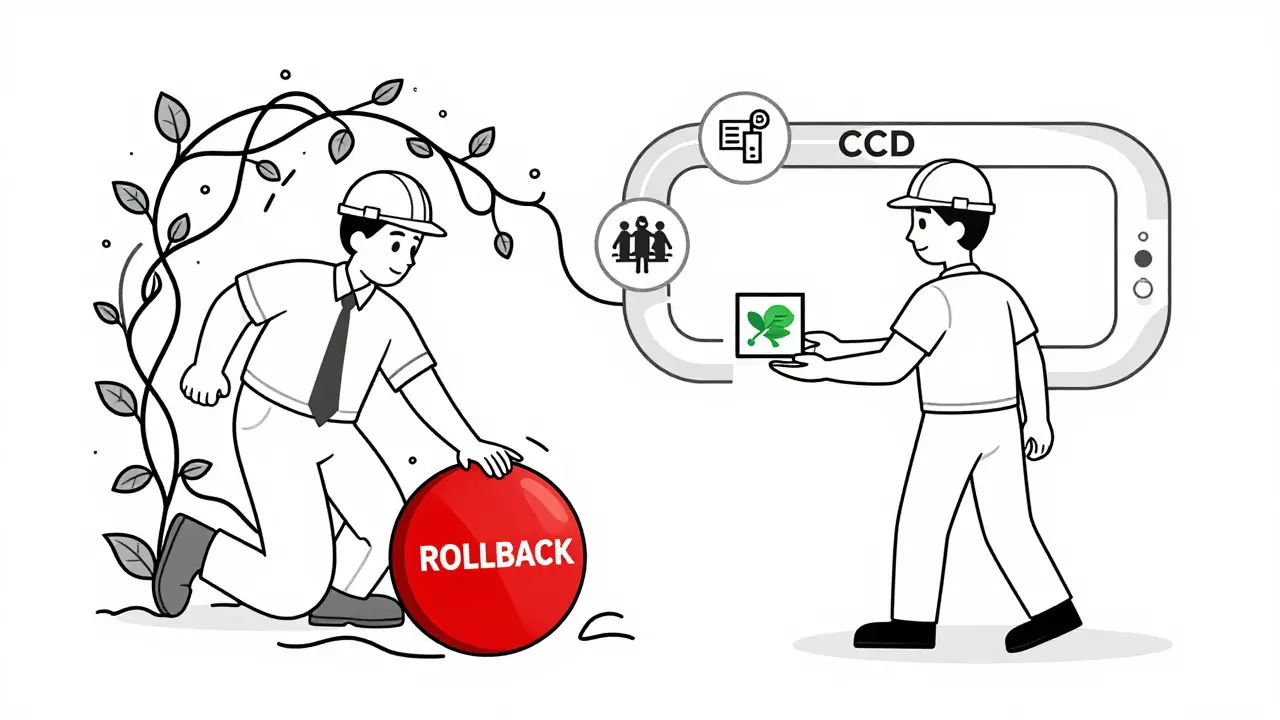
Start with symptom-based alerts, not cause-based ones. Don’t alert on "high cyclomatic complexity." That’s a code review problem. Instead, alert on "rollback rate increased by 30% in 24 hours." That’s a real, observable failure.
Use multi-window burn rates. If your MTTR SLO is 1 hour, set a 6-hour window to catch sudden spikes and a 72-hour window to spot slow degradation. Splunk’s 2024 guide shows 68% of teams that do this avoid major incidents.
And never, ever alert during planned maintenance. Add a 24- to 72-hour cooldown period after deployments. Otherwise, engineers will disable alerts entirely.
Why Most Maintainability SLOs Fail
It’s not the metrics. It’s the setup.
Most teams make three mistakes:
- Tracking vanity metrics. "Lines of code changed" or "number of PRs merged" sound impressive but mean nothing. A team can merge 50 PRs a day and still ship broken code.
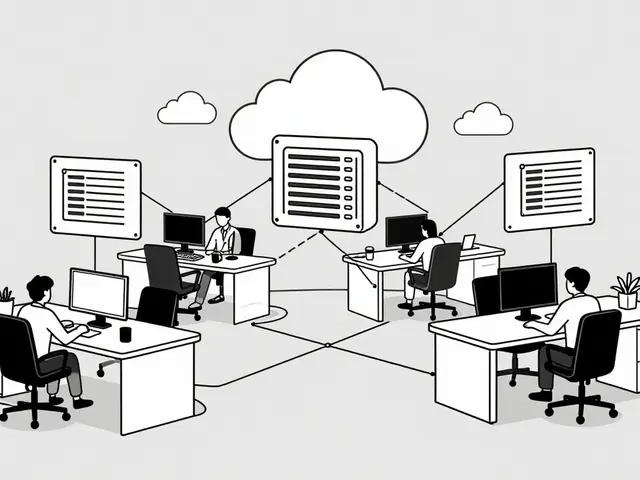
- Ignoring data silos. If your CI/CD tool doesn’t talk to your incident tracker, you’re guessing. 61% of teams struggle to connect these systems. Use tools like Nobl9 or Blameless that natively integrate them.
- Not aligning with business goals. One product manager shared: "We hit all our SLOs-but missed customer deadlines because we optimized for speed over completeness." Maintainability SLOs must tie to user outcomes. For example: "If lead time drops below 2 days, customer satisfaction increases by 15%."
And don’t start before you’re ready. Gartner found 71% of failed SLO implementations happened because teams skipped foundational reliability metrics first. Get your uptime and error rates under control before adding maintainability targets.
What Success Looks Like
Real teams are doing this right.
A financial services firm set an MTTR SLO of 45 minutes. Within six months, engineer burnout dropped. Why? Because they stopped being on-call 24/7. Incidents became predictable. They knew when to sleep.
An e-commerce company targeted 20 deployments per day. They didn’t just deploy faster-they reduced customer complaints by 41%. Why? Because small, frequent changes mean smaller failures. A bug in one small deploy affects 0.1% of users. A big deploy affects 10%.
These teams didn’t buy new software. They just started measuring the right things and acting on them.
Where the Industry Is Headed
By 2026, 75% of organizations will tie maintainability SLOs directly to business outcomes. That means:
- "Feature delivery lead time" linked to "customer acquisition rate"
- "Change failure rate" tied to "support ticket volume"
- "Deployment frequency" connected to "revenue from new features"
Google’s 2024 update introduced "maintainability health scores"-a single number from 0 to 100 that combines MTTR, deployment rate, and technical debt. AWS just rolled out the same in CloudWatch Application Signals.
This isn’t just engineering anymore. It’s business strategy. If your software can’t evolve, your company can’t compete.
Getting Started Today
You don’t need a fancy tool. Start with these three steps:
- Pick one SLI. Start with MTTR. It’s the easiest to measure and the most urgent.
- Define your target. "We will recover from production incidents in under 1 hour, 95% of the time."
- Set a simple alert. If MTTR crosses 1 hour for 3 days straight, notify the engineering lead.
After 30 days, review. Did it help? Did engineers feel less stressed? Did incidents drop? Then add another SLI. Deployment frequency. Change failure rate. One at a time.
Don’t try to do everything. The goal isn’t perfection. It’s progress. If you can make one change predictable, you’ve already won.
What’s the difference between a maintainability SLO and a traditional SLO?
Traditional SLOs measure system health-like uptime, latency, or error rates. Maintainability SLOs measure how easy it is to change the system. For example, uptime SLO: "99.9% availability." Maintainability SLO: "95% of deployments succeed without rollback." One keeps the lights on. The other keeps the system alive for future changes.
Can small teams use maintainability SLOs?
Yes-and they benefit the most. Startups with 3 engineers can set an MTTR SLO of under 2 hours and a deployment frequency of once per day. These aren’t enterprise-level goals. They’re survival tactics. Teams that measure change get faster, more stable systems-even with limited resources.
Do I need special software to implement maintainability SLOs?
No. You can start with basic tools: GitHub for code, Jenkins or GitLab CI for deployments, and Slack alerts for incidents. The real requirement isn’t software-it’s discipline. Track the metrics manually for 30 days. If they’re useful, then invest in tools like Nobl9 or Blameless. Most teams skip this step and buy tools too early.
How do I convince my team to care about maintainability SLOs?
Show them the pain. Pull up your last month’s incident logs. How many were caused by old, brittle code? How many hours were lost to manual rollbacks? Frame it as reducing firefighting. Engineers don’t resist metrics-they resist burnout. If your SLOs help them sleep better, they’ll adopt them.
What if my SLO target is too hard to hit?
Adjust it. SLOs aren’t set in stone. If your change failure rate is 30% and your target is 10%, don’t panic. Investigate. What’s causing the failures? Is it testing? Deployment automation? Documentation? Fix the root cause, then reset the target. The goal isn’t to hit a number-it’s to improve over time.
Are maintainability SLOs only for software teams?
No. Any team that updates systems regularly can use them. Infrastructure teams, DevOps, even IT support can apply MTTR or deployment frequency SLOs to their workflows. The principle is the same: if you change something, measure how easy it is to change again.
 Artificial Intelligence


Amit Umarani
March 17, 2026 AT 18:50MTTR under an hour? Sure, if you’re deploying 50 times a day and have 20 engineers on call. In real life, we’re lucky if we get one deploy per week. And don’t get me started on the ‘technical debt ratio’-who measures that? Some guy in a spreadsheet who’s never seen a production log?
Stop pretending this is a science. It’s just corporate buzzword bingo with extra steps.
Noel Dhiraj
March 18, 2026 AT 00:50I’ve seen teams go from 48-hour outages to 15-minute fixes just by tracking MTTR and cutting down manual approvals. No fancy tools, just discipline. Start small. Pick one metric. Do it for 30 days. You’ll be shocked how much less stress you feel.
It’s not about perfection. It’s about not being on call at 3am for the fifth time this month.
vidhi patel
March 19, 2026 AT 11:02There is a fundamental flaw in your entire argument. You claim that ‘maintainability SLOs turn vague complaints into concrete targets’-yet you provide no standardized methodology for data collection, no validation of source integrity, and no control for confounding variables. This is not engineering. This is opinion masquerading as data.
The 47% faster incident resolution statistic? Source? Peer-reviewed? Or just a blog post from a Google SRE who got promoted after writing a Medium article?
Priti Yadav
March 20, 2026 AT 03:15Let me guess-you work for a company that’s using Nobl9 and thinks it’s magic. Meanwhile, your ‘deployment frequency’ metric is just a bot that auto-merges PRs after 30 seconds of review. You’re not measuring maintainability-you’re measuring how good you are at gaming the system.
And don’t even get me started on ‘technical debt ratio.’ That’s just a number the CTO uses to justify firing the senior devs who wrote the ‘messy’ code. Real maintainability? It’s in the culture. Not in dashboards.
Ajit Kumar
March 20, 2026 AT 17:15It is imperative to recognize that the entire paradigm of maintainability SLOs, as presented here, is predicated upon a deeply flawed assumption: that software systems can be objectively quantified in terms of ‘ease of change.’ This is a category error. Software is not a mechanical system; it is a cognitive artifact, shaped by human intention, historical accident, and emergent complexity.
By reducing the nuanced reality of legacy systems to five metrics, we are not solving problems-we are merely obscuring them with statistical smoke. The true cost of maintainability is not measured in hours or percentages, but in the erosion of institutional knowledge, the attrition of experienced engineers, and the quiet despair of those who inherit code written by someone who left three years ago-and never left a comment.
Diwakar Pandey
March 20, 2026 AT 22:18Just wanted to say: I started with MTTR last quarter. No tool. Just a spreadsheet. Logged every incident, how long it took, and what actually caused it.
Turns out, 60% of our ‘outages’ were just people waiting for someone to approve a deploy. We automated the approval. Now we’re down to 22-minute average MTTR.
Didn’t need a new tool. Just needed to listen. And stop pretending we’re doing DevOps when we’re still stuck in 2015.
Geet Ramchandani
March 22, 2026 AT 09:36Oh, so now we’re going to fix ‘maintainability’ by slapping more alerts on engineers? Great. Because nothing says ‘we care about your mental health’ like another dashboard that turns red every time someone forgets to run tests.
Let me guess: the same people who wrote this post are the ones who still use ‘git commit -m “fix”’ and then blame the juniors when the pipeline breaks. You want to measure change? Start by measuring how many times your ‘leadership’ has blocked a deploy because they ‘wanted to see it first.’
This isn’t about SLOs. It’s about accountability. And nobody here wants to take responsibility for their own chaos.
Pooja Kalra
March 22, 2026 AT 13:40There is a deeper question here, one buried beneath the metrics and the dashboards: what are we really optimizing for? Speed? Or control?
If we make change ‘predictable, safe, and fast,’ are we not also making it sterile? Are we not engineering out the possibility of innovation, of the unexpected solution that emerges from chaos? The most maintainable codebase is often the one that no one dares touch.
Perhaps the real cost of maintainability is not the burnout-it is the silence.
Sumit SM
March 22, 2026 AT 19:28And yet-here we are-still debating metrics while the world moves on. AWS just rolled out maintainability health scores. Google’s now integrating them into their entire performance review system. The market is shifting. The question isn’t whether you should adopt this-it’s whether you’ll be left behind.
Yes, it’s messy. Yes, it’s hard. But if you’re still saying ‘we’ll get to it next quarter,’ you’re already behind. The teams that win aren’t the ones with the best code-they’re the ones who measure what matters, and then act.
Jen Deschambeault
March 24, 2026 AT 10:57My team started with deployment frequency. We went from once a month to twice a week. Customer complaints dropped. Stress dropped. We didn’t even need new tools-just a change in mindset.
Small steps. That’s all it takes.