
Tag: evaluation benchmarks
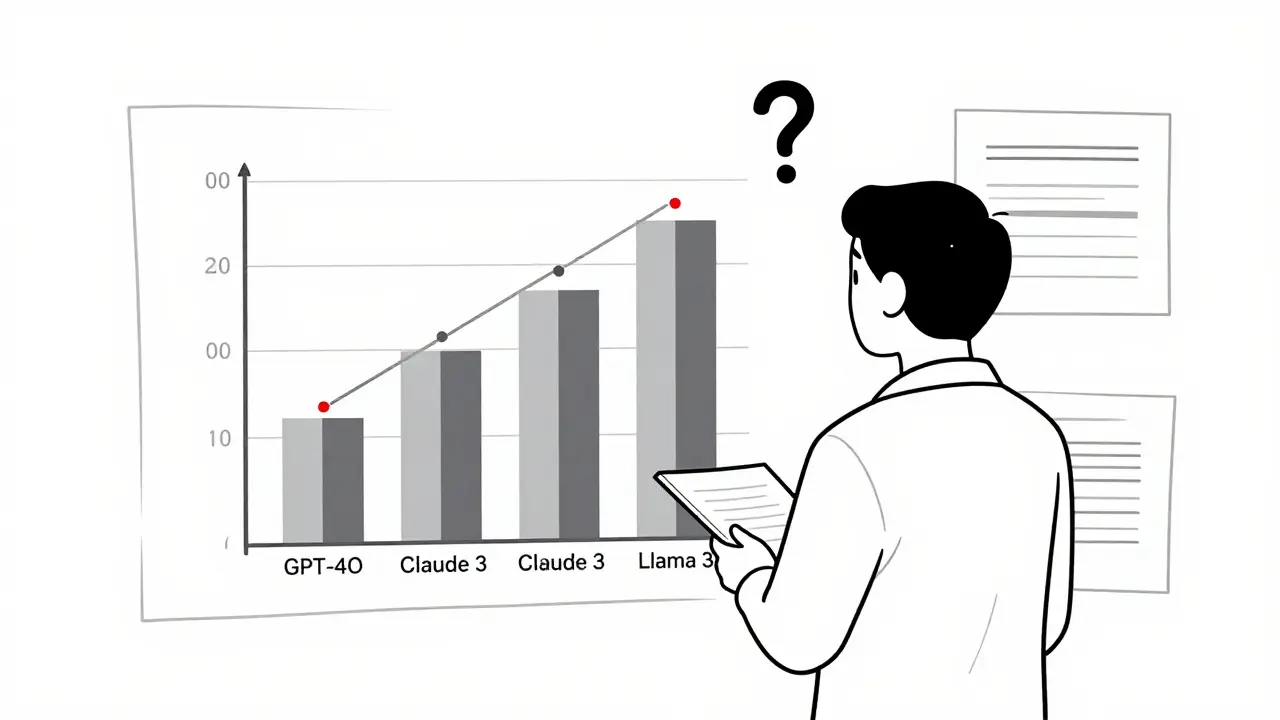
Learn how to visualize LLM evaluation results effectively using bar charts, scatter plots, heatmaps, and parallel coordinates. Avoid common pitfalls and choose the right tool for your needs.
Categories
 Artificial Intelligence
Archives
Recent-posts
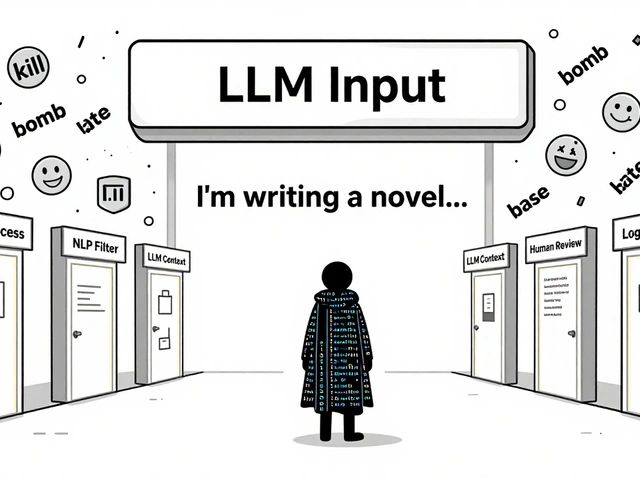
Content Moderation Pipelines for User-Generated Inputs to LLMs: How to Prevent Harmful Content in Real Time
Aug, 2 2025

Safety in Multimodal Generative AI: How Content Filters Block Harmful Images and Audio
Feb, 15 2026

Pattern Libraries for AI: How Reusable Templates Improve Vibe Coding
Jan, 8 2026

Pretraining Objectives in Generative AI: Masked Modeling, Next-Token Prediction, and Denoising
Mar, 8 2026

How Finance Teams Use Generative AI for Smarter Forecasting and Variance Analysis
Dec, 18 2025