
Tag: LLM evaluation
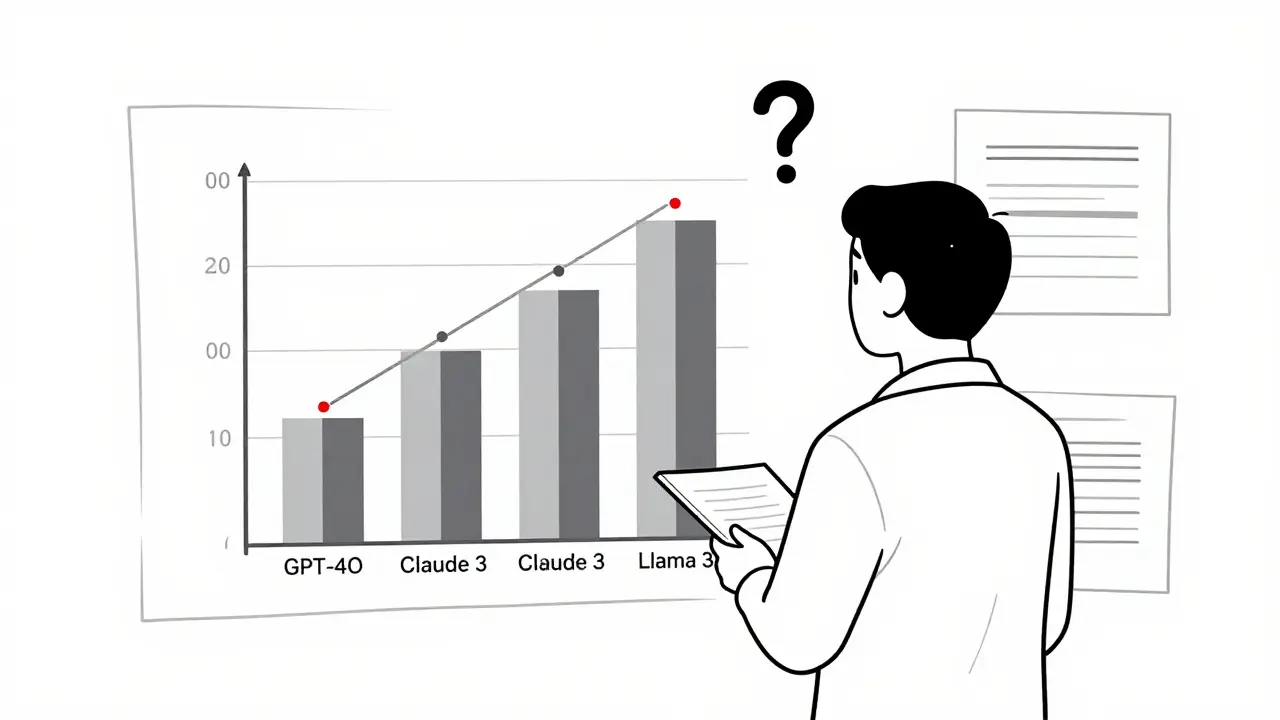
Learn how to visualize LLM evaluation results effectively using bar charts, scatter plots, heatmaps, and parallel coordinates. Avoid common pitfalls and choose the right tool for your needs.
Categories
 Artificial Intelligence
Archives
Recent-posts
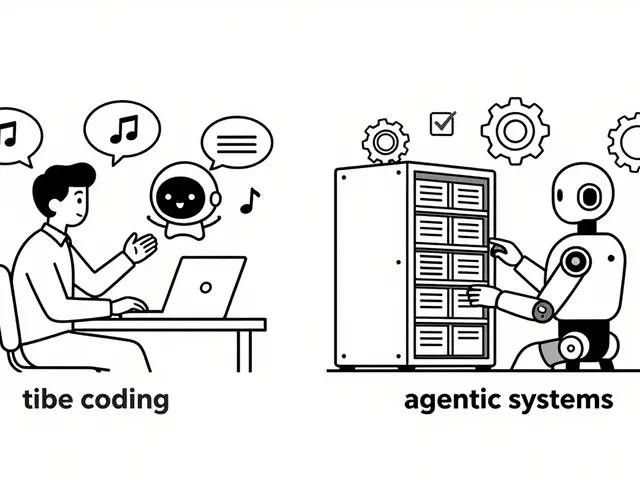
Agentic Systems vs Vibe Coding: Choosing the Right Autonomy Level
Jun, 17 2026

How Generative AI Is Transforming Prior Authorization Letters and Clinical Summaries in Healthcare Admin
Dec, 15 2025

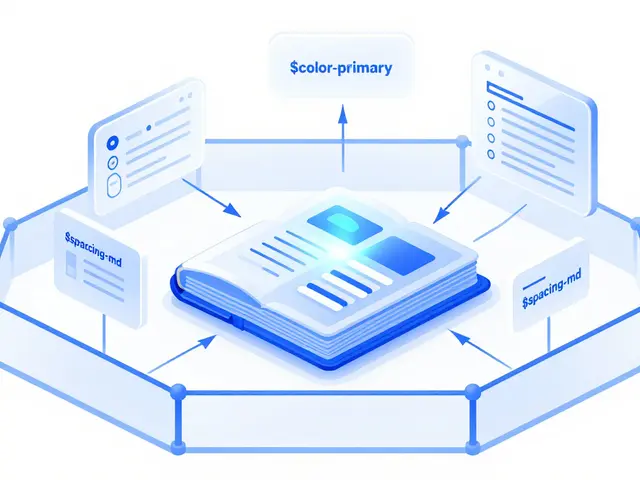
Design Tokens and Theming in AI-Generated UI Systems
Feb, 13 2026

Why Understanding Every Line of AI-Generated Code Isn't the Goal in Vibe Coding
Mar, 27 2026
Design Systems for AI-Generated UI: Keeping Components Consistent
Mar, 11 2026