
Tag: visualization techniques
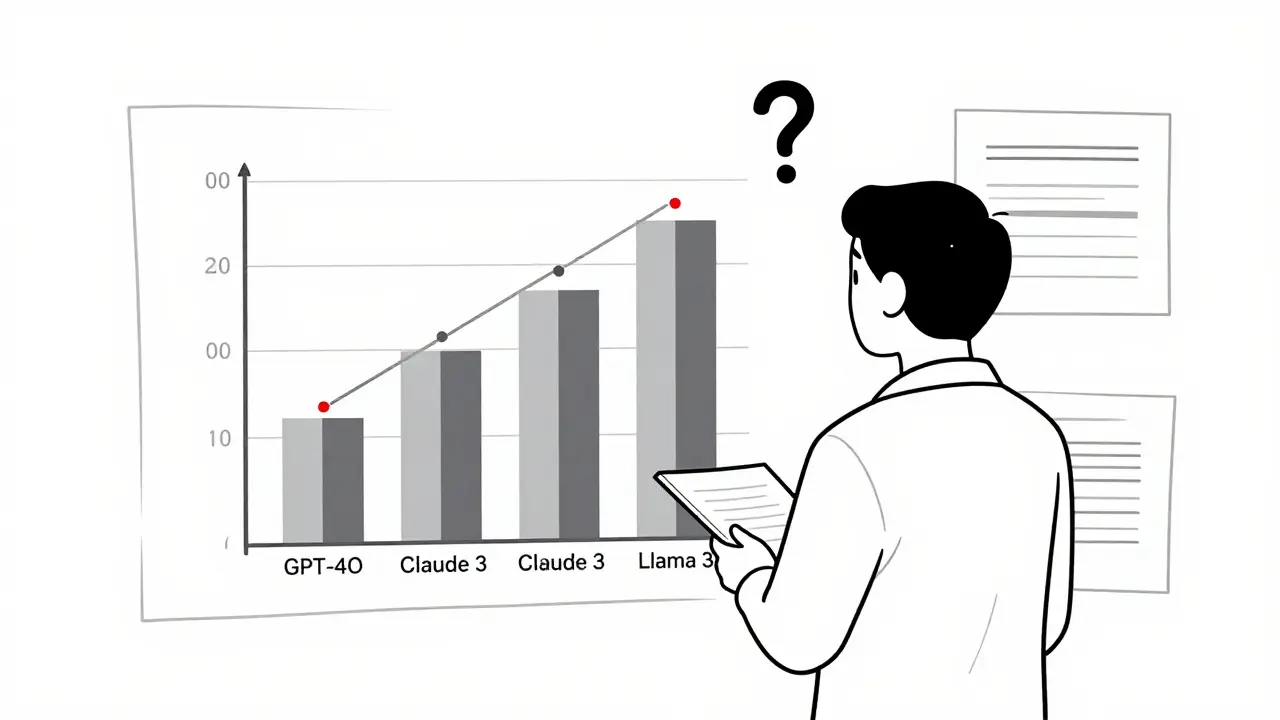
Learn how to visualize LLM evaluation results effectively using bar charts, scatter plots, heatmaps, and parallel coordinates. Avoid common pitfalls and choose the right tool for your needs.
Categories
 Artificial Intelligence
Archives
Recent-posts
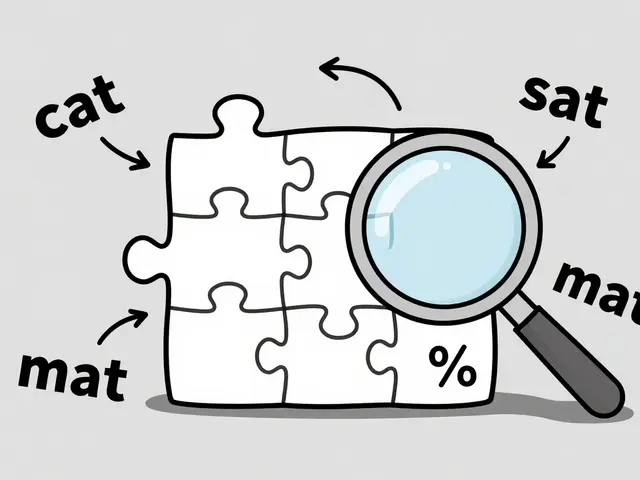
Pretraining Objectives in Generative AI: Masked Modeling, Next-Token Prediction, and Denoising
Mar, 8 2026

Tiered Governance for Vibe-Coded Apps: Matching Controls to Risk
Mar, 21 2026
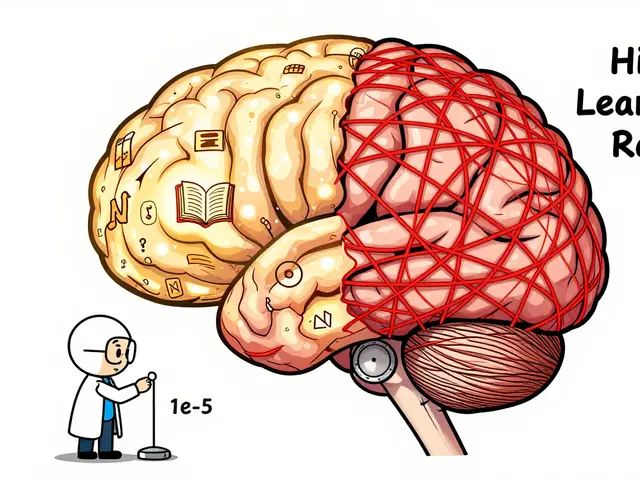
Hyperparameter Selection for Fine-Tuning Large Language Models Without Forgetting
Feb, 11 2026
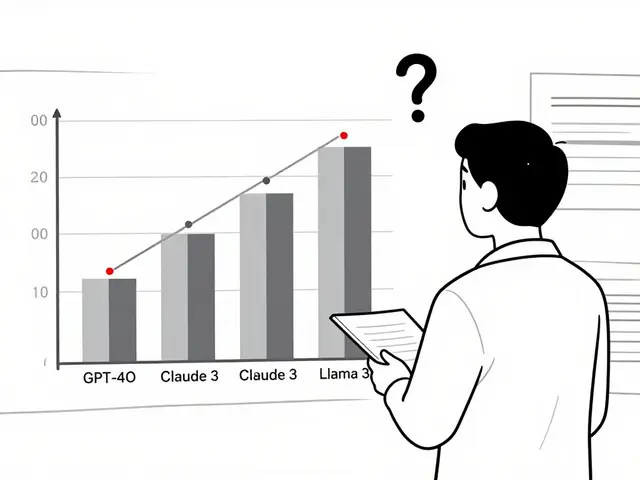
Visualization Techniques for Large Language Model Evaluation Results
Dec, 24 2025

Performance Budgets for Frontend Development: Set, Measure, Enforce
Jan, 4 2026