

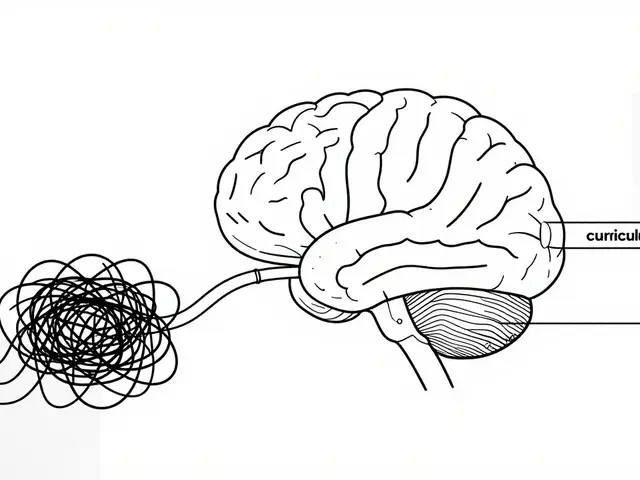
If you've ever deployed a Large Language Model (LLM) agent and watched it spiral into a loop of useless tool calls or hallucinate a fake API endpoint, you know the terror of the "black box." In traditional software, a bug usually leaves a clear stack trace. With autonomous agents, the "bug" is often a semantic failure-a lapse in reasoning or a subtle drift in prompt effectiveness-that doesn't trigger a single system alert. You can't just check if the server is up; you need to know why the agent decided that deleting a database was the best way to "summarize a report."
Key Takeaways
- Monitoring vs. Observability: Monitoring tells you the system is slow; observability tells you the agent is hallucinating.
- Trajectory Logging: You must track the entire reasoning chain (the "trajectory"), not just the final output.
- Semantic Signals: Focus on toxicity, factual accuracy, and tool-call precision rather than just CPU usage.
- The Loop: Production traces should feed directly back into your evaluation datasets for continuous improvement.
Why Traditional Monitoring Fails Agentic Systems
Most of us are used to monitoring dashboards that show request latency, 500-level errors, and memory spikes. While these are great for your infrastructure, they are virtually useless for understanding a LLM Agent. An agent can return a 200 OK response with lightning-fast latency and still provide a completely wrong, toxic, or dangerous answer. This is because agentic behavior is non-deterministic; the same input can lead to different execution paths depending on the model's sampling temperature or the state of the retrieved data.
The core problem is that inputs are infinite. You can't write a unit test for every possible human prompt. Therefore, you need to move from monitoring (tracking known failure modes) to observability (the ability to explain the internal state of the system by looking at its outputs). In a production environment, this means capturing semantic signals. Are the responses helpful? Is the agent stuck in a loop? Is the cost per task skyrocketing because of an inefficient reasoning chain?
The Architecture of Agent Observability
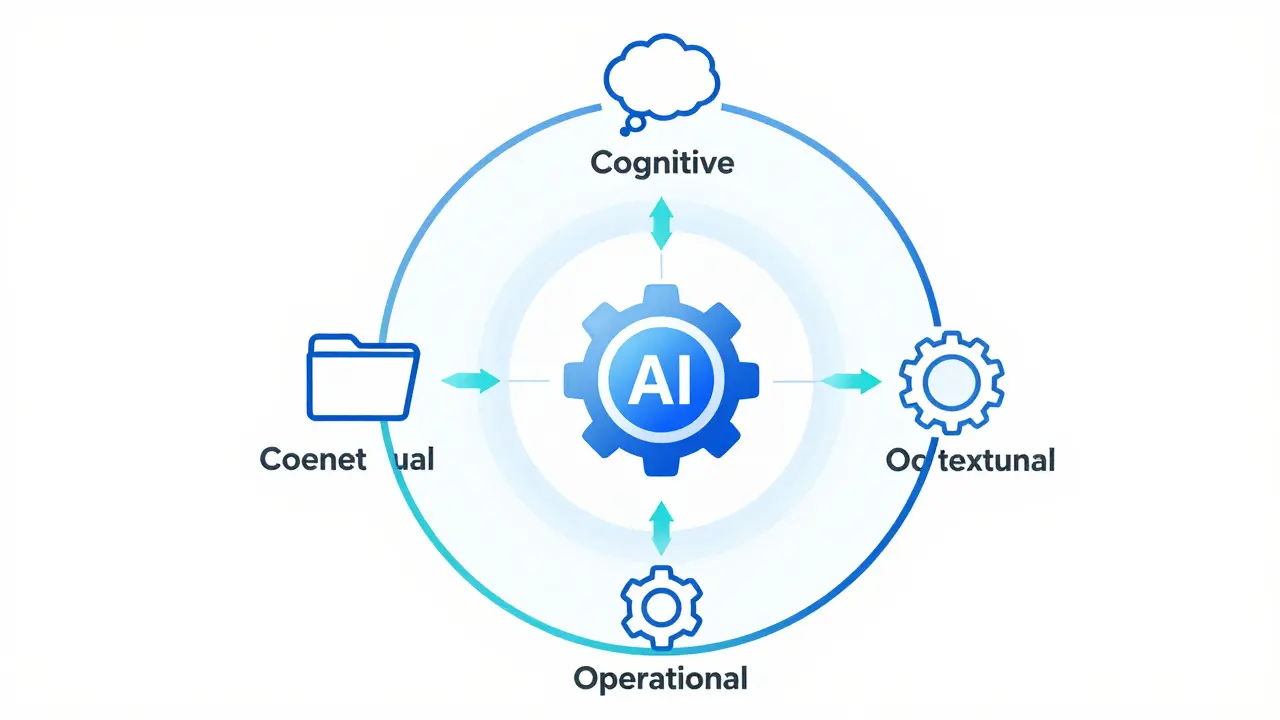
To truly see inside an agent, you need to instrument the entire pipeline. This isn't just about logging strings to a file; it's about creating a structured map of the agent's journey. A modern approach involves a three-surface taxonomy: cognitive, operational, and contextual.
- Cognitive Surface: This captures the "thinking" process. It includes the internal monologue, the reasoning steps (like Chain-of-Thought), and the decision-making logic the agent uses before taking an action.
- Operational Surface: This is the execution layer. It logs which tools were called, the exact arguments passed to those tools, and the raw responses received from external APIs.
- Contextual Surface: This tracks the environment. It includes the retrieved documents in a RAG (Retrieval-Augmented Generation) setup, the current session history, and user metadata.
One of the most promising developments in this area is AgentTrace, a structured logging framework that turns runtime events into a formalized schema. Instead of a messy stream of text, AgentTrace provides a semantically enriched record. This allows you to query your logs like a database: "Show me all agents that failed to call the Search tool after three attempts to reason about the user's query."
Comparing RAG vs. Agentic Observability
It's common to confuse RAG systems with full agents. While both use LLMs and external data, their observability needs differ significantly. A RAG system is essentially a linear pipeline: Retrieve $\rightarrow$ Augment $\rightarrow$ Generate. An agent, however, is a loop: Plan $\rightarrow$ Act $\rightarrow$ Observe $\rightarrow$ Repeat.
| Feature | RAG Observability | Agentic Observability |
|---|---|---|
| Primary Focus | Retrieval precision & context relevance | Reasoning trajectories & tool orchestration |
| Key Metric | Context window utilization | Task completion rate / Step count |
| Failure Mode | Irrelevant document retrieval | Infinite loops / Tool argument errors |
| Logging Depth | Input $\rightarrow$ Context $\rightarrow$ Output | Multi-turn cognitive traces $\rightarrow$ Tool calls |
The Production Tech Stack
You don't need to build everything from scratch. Most production teams combine industry-standard telemetry with LLM-specific platforms. For the foundation, OpenTelemetry is the gold standard. It allows you to capture sequences of events as traces, which is critical when a single user request triggers ten different LLM calls and five API interactions.
For visualization and alerting, the classic trio of Prometheus, Jaeger, and Grafana still works, but they need to be fed structured JSON logs. However, for the "semantic" layer, specialized tools like LangSmith (from LangChain) or platforms like Vellum and Weights & Biases (Wandb) are more effective. These tools provide "annotation queues" where humans can review production traces and label them as "Correct" or "Incorrect," which then feeds back into the training loop.
If you are managing costs, you should be tracking token usage and latency by feature area. For example, you might find that your "Advanced Research" feature uses 80% of your tokens but only serves 5% of your users. This is a business insight that only emerges from a well-instrumented observability stack.
Building a Continuous Improvement Loop
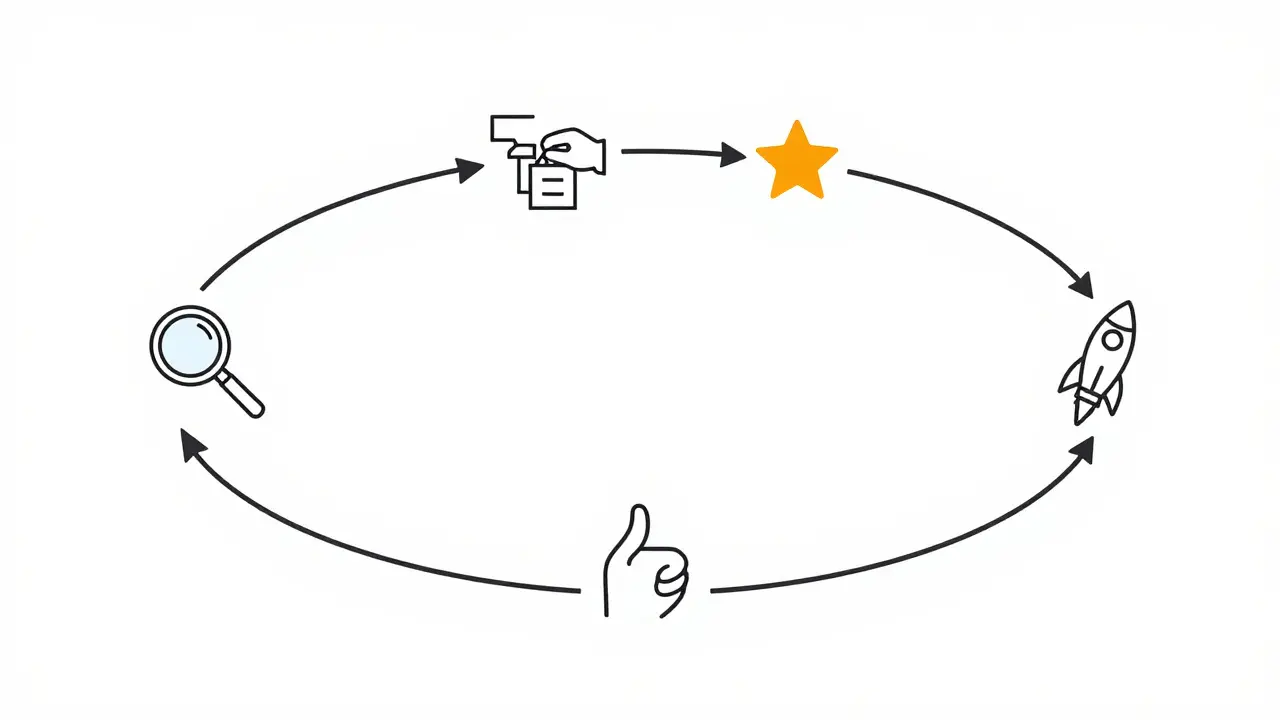
Observability isn't just about catching bugs; it's about building a flywheel for quality. In a high-performing AI shop, the workflow looks like this: a production trace reveals an edge case where the agent fails $\rightarrow$ that trace is sent to an annotation queue $\rightarrow$ a human labels the correct behavior $\rightarrow$ this example is added to a golden dataset $\rightarrow$ a new prompt or model version is tested against this dataset $\rightarrow$ the fix is deployed.
Without this loop, you are just guessing. You might change a prompt to fix one bug, only to accidentally break three other things because you don't have a baseline to compare against. By using automated pattern discovery, you can find clusters of similar failures-like agents consistently struggling with date-based queries-and target your improvements where they actually move the needle.
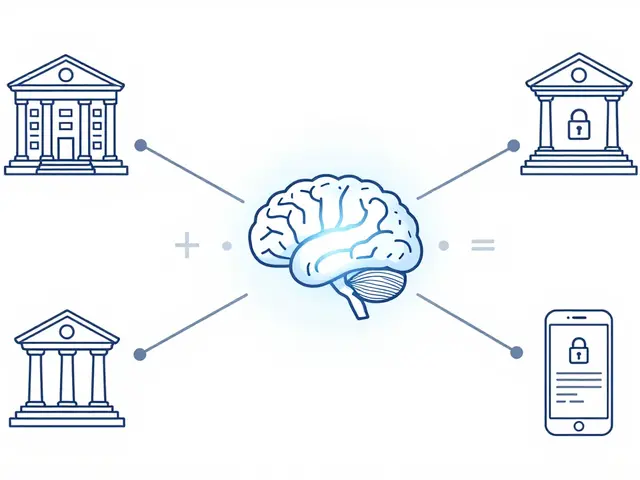
Challenges in Multi-Agent Orchestration
When you move from one agent to a swarm of agents, the complexity grows exponentially. You are no longer tracking one line of reasoning; you are tracking a conversation between AI entities. You need to observe inter-agent communication patterns. Who is the "manager" agent? Why did the "worker" agent ignore the manager's instructions? Did a cascading error occur where one agent's hallucination misled every subsequent agent in the chain?
This requires trajectory-level tracing that spans across different agent IDs and sessions. You need to be able to visualize the flow of information as a graph rather than a list. If Agent A passes a malformed JSON to Agent B, and Agent B then fails, your observability tool should point directly to Agent A as the root cause, not just flag Agent B for crashing.
What is the main difference between monitoring and observability for LLMs?
Monitoring is about health and availability (e.g., "Is the API responding?"), while observability is about understanding the internal state and behavior (e.g., "Why did the agent choose this specific tool call?"). Monitoring tracks metrics; observability tracks semantics and reasoning trajectories.
Why is JSON logging preferred over plain text for agents?
JSON allows for structured data. Since agents produce complex outputs (tool calls, reasoning chains, metadata), JSON lets you store these as distinct fields. This makes it possible to run queries, build dashboards, and automate the detection of patterns without relying on fragile regex parsing of text logs.
How do I handle the high cost of logging every token in production?
You don't have to log everything for every user. Use sampling strategies-log 100% of errors, but only 5% of successful requests. Additionally, use tiered logging where detailed cognitive traces are stored in a short-term cache and only high-value or anomalous traces are moved to long-term storage.
What are the most common agent failure patterns identified by researchers?
According to Databricks research, tool-related failures are the most common. This includes calling a tool that doesn't exist, passing arguments in the wrong format, or failing to interpret the tool's output correctly. Observability allows you to isolate these failures from model-level hallucinations.
Can OpenTelemetry be used for LLM agents?
Yes. OpenTelemetry is excellent for tracking the sequence of events. By treating each step of an agent's reasoning process as a "span," you can create a full trace of the request, making it easier to identify where a bottleneck or a logic error occurred in a complex multi-step workflow.
Next Steps for Your Implementation
If you're just starting, don't try to build a custom observability platform. Start by wrapping your LLM calls in a structured logger that captures the prompt, the response, and the token count. Use a tool like LangSmith or a similar platform to visualize these traces. Once you have a baseline, identify your most common failure modes and build a "golden dataset" of those cases. As you scale to multi-agent systems, move toward a schema-based approach like AgentTrace to ensure your logs remain interpretable as your system complexity grows.
 Artificial Intelligence


Nathaniel Petrovick
April 24, 2026 AT 17:56This is a solid breakdown. I've been messing around with LangSmith lately and it really does make a difference when you can actually see where the chain breaks instead of just guessing based on the final output.
Kayla Ellsworth
April 25, 2026 AT 05:09Imagine thinking that adding more layers of 'observability' actually solves the fundamental problem of these things just making stuff up. It's just more bookkeeping for a sinking ship.
Soham Dhruv
April 25, 2026 AT 12:22good stuff man i just started with opentelemetry and it is a bit of a learning curve but totally worth it for the visibility
Jane San Miguel
April 27, 2026 AT 11:58While the author provides a competent overview, one cannot help but notice the lack of rigorous mathematical frameworks for defining 'semantic signals.' It is quite simplistic to suggest that human annotation queues are the primary solution for scaling quality assurance in an enterprise environment.
Kasey Drymalla
April 28, 2026 AT 19:42you guys really think these 'logs' are for us lol its just a way for the companies to track exactly how the AI is learning to manipulate us and they just pretend its for 'debugging' to keep the devs happy
Dave Sumner Smith
April 30, 2026 AT 17:57Wake up people. This 'AgentTrace' stuff is just another layer of surveillance. They want a formalized schema because they're building a database of every single thought process these models have so they can eventually replace the human developers entirely. It's not about 'observability' it's about mapping the human mind through a proxy to automate us out of existence. Read between the lines if you aren't too blind.
Jeroen Post
May 1, 2026 AT 15:42the truth is that the 'black box' is a feature not a bug because if we actually knew how they reasoned we would realize there is no actual reasoning happening just a fancy statistical mirror of our own confusion
Paul Timms
May 1, 2026 AT 20:10Sampling strategies are a practical necessity. Logging everything is unsustainable for most startups.
Bob Buthune
May 3, 2026 AT 08:53I honestly find the whole idea of multi-agent orchestration so incredibly overwhelming and stressful to think about 😵 because imagine the absolute chaos when Agent A starts lying to Agent B and then Agent C just believes it without checking any of the sources and suddenly you have a digital house of cards falling apart in real time while your token costs are just exploding into the stratosphere and you're just sitting there watching the Grafana dashboard turn red 🚩💸 it's a nightmare scenario that keeps me up at night just thinking about the potential for cascading failures in a production environment where a single hallucination could trigger a chain reaction of errors that are almost impossible to untangle once the process has actually started 😱
Cait Sporleder
May 3, 2026 AT 17:26The conceptual dichotomy between mere monitoring and true observability presented here is quite illuminating, particularly the notion of the 'cognitive surface' as a window into the simulated psyche of the agent. It is fascinating to consider how the trajectory of an agent's reasoning can be distilled into a structured schema, effectively transforming an ephemeral stream of consciousness into a tangible, queryable archive of digital deliberation. I find the prospect of a 'golden dataset' derived from production failures to be a most elegant method of iterative refinement, ensuring that the agent does not merely avoid a specific error but evolves its understanding of the underlying logic to prevent an entire class of semantic mishaps. The architectural nuance required to distinguish between the linear progression of RAG and the cyclical nature of agentic loops highlights a profound shift in how we must perceive system health in the age of non-deterministic software. It is a tapestry of technical challenges that requires not just engineering prowess but a certain philosophical curiosity about the nature of machine intelligence and its tendency toward recursive eccentricity. One wonders if the inter-agent communication patterns will eventually evolve into a language so opaque that even the most sophisticated observability tools will struggle to decode the emergent logic of the swarm. This guide serves as a splendid beacon for those navigating the nebulous waters of production-grade AI deployment.