It is easy to get swept up in the hype. You hear that generative AI boosts productivity by 30% or even 50%, and suddenly you feel like your team is falling behind if they aren't using it every second of the day. But here is the uncomfortable truth: without a solid productivity baselinea systematic measurement of work output, time use, and quality before AI deployment, those numbers are just guesses. If you do not know how fast your team was moving before, you cannot prove that the new tool made them faster. In fact, you might be making things worse while thinking you are winning.
This is not just about tracking hours. It is about designing fair comparisons. When we measure the impact of Generative AIartificial intelligence systems capable of creating text, code, and images from prompts, we need more than a gut feeling. We need rigorous, multi-dimensional data collected before the first prompt is ever typed. This guide explains how to build those baselines so you can calculate real ROI, avoid biased metrics, and make decisions based on facts rather than marketing brochures.
Why Your Current Metrics Are Likely Wrong
Most companies jump straight into deployment. They install the tools, tell everyone to use them, and then look at the output. The problem? You have changed two variables at once: the workflow and the tool. If productivity goes up, great. If it stays flat, did the AI fail, or was the baseline already high? If it drops, is the AI bad, or did you disrupt a process that was actually working well?
Research from the OECD highlights this gap. Micro-level studies show average individual productivity gains of about 30% when generative AI assistance is introduced. However, these gains are calculated against a control group-a strict baseline where workers performed tasks without AI. Without that controlled comparison, you cannot separate the signal from the noise. A 14% increase in customer support ticket resolution speed sounds impressive until you realize that the previous "baseline" included days where agents were sick, distracted, or dealing with unrelated system outages.
To design a fair comparison, you must accept that pre-AI data collection is as critical as the AI model itself. You are essentially running a scientific experiment on your own business. The baseline is your control group. If the control group is messy, the results are meaningless.
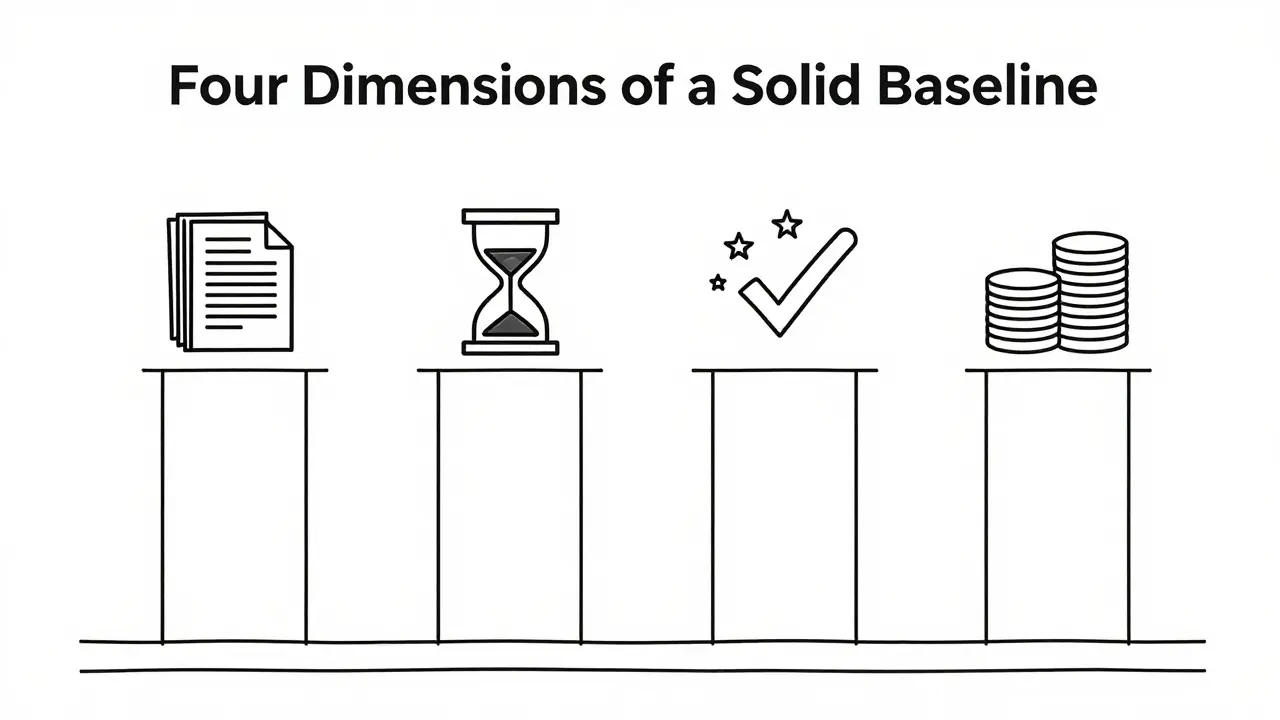
The Four Dimensions of a Solid Baseline
A common mistake is measuring only one thing, usually volume. Did we write more emails? Did we code more lines? Volume is dangerous because generative AI can inflate quantity while deflating quality. A robust baseline must cover four specific dimensions:
- Output Volume: The raw count of completed tasks (e.g., number of reports generated, tickets closed).
- Time Input: The actual hours spent on focused work versus collaboration or reactive tasks.
- Quality Scores: Error rates, defect counts, or customer satisfaction (CSAT) scores.
- Cost per Unit: The financial cost associated with producing each unit of output.
For example, consider a software development team. Before introducing an AI coding assistant, you need to record how long it takes to write a standard function (Time Input), how many bugs are found in post-merge testing (Quality Score), and how many functions are shipped per sprint (Output Volume). If the AI cuts writing time by half but doubles the bug rate, your net productivity might actually decrease due to the increased time spent fixing errors. Only a multi-dimensional baseline reveals this trade-off.
Capturing the Hidden Costs: Time and Interruptions
Work is not just about what gets done; it is about how it gets done. Workforce analytics providers like ActivTrak emphasize that digital activity data reveals patterns that simple task lists miss. To build a fair baseline, you need to understand the rhythm of your team's day before AI changes it.
You should track three specific types of time usage over a meaningful period-typically several weeks-to smooth out daily fluctuations:
- Focused Work Time: Uninterrupted periods spent in deep work applications (IDEs, word processors, spreadsheets).
- Collaboration Time: Meetings, messaging apps, and synchronous communication.
- Reactive Work: Email triage, ad-hoc requests, and context-switching interruptions.
Why does this matter for AI? Because generative AI often shifts work rather than eliminating it. An employee might spend less time drafting an email (focused work) but more time reviewing and editing the AI's output (reactive work). If you only measure "emails sent," you see a win. If you measure "total cognitive load" and "interruption frequency," you might see that the employee is now more fragmented and stressed. A fair baseline captures these behavioral shifts so you can evaluate whether the AI is truly helping or just reshuffling the deck.
Stratifying by Skill and Task Type
One size does not fit all. A major pitfall in AI evaluation is using a single average baseline for an entire department. Research on the "productivity divide" shows that generative AI affects different workers differently. Less experienced workers often see larger percentage gains because the AI acts as a tutor, raising their performance closer to that of experts. Experts, however, might see smaller relative gains because they were already operating near peak efficiency.
If you average these groups together, you mask important equity issues. For instance, if junior writers improve by 50% and senior writers improve by 10%, the average gain is 30%. But if you raise the performance target for everyone by 30%, you are setting the seniors up for failure and potentially devaluing their expertise. Fair comparisons require stratified baselines:
| Worker Segment | Baseline Metric Focus | AI Impact Expectation |
|---|---|---|
| Junior / New Hires | Learning curve speed, error reduction | High gain in quality and speed |
| Senior / Experts | Innovation time, complex problem solving | Moderate gain, focus on delegation |
| Administrative Support | Task throughput, routine processing | Very high gain in volume |
By segmenting your baseline data by tenure, skill level, or role, you can identify who benefits most and adjust your expectations accordingly. This prevents the "average fallacy" where overall improvements hide stagnation in key roles.
Micro vs. Macro: Understanding the Scale
When reading news about AI productivity, you will see conflicting numbers. Some sources claim massive individual gains, while economic models suggest modest aggregate growth. Both can be true, but they rely on different baselines.
At the micro level, controlled experiments (like those summarized by the OECD) compare an individual worker with AI against the same worker without AI. Here, gains of 30-50% are common for specific tasks like coding or writing. At the macro level, institutions like the Federal Reserve Bank of St. Louis look at national productivity trends. They estimated that generative AI raised U.S. aggregate productivity by approximately 1.1% in late 2024 compared to a 2022 pre-AI baseline. Why the difference?
Because macro baselines include friction. Not everyone adopts the tool immediately. Some industries are not suited for AI. There are integration costs, training periods, and organizational inertia. As a business leader, you need to decide which scale applies to you. If you are evaluating a pilot program, use micro-level baselines (task-specific, controlled). If you are forecasting annual revenue, use macro-level logic (adoption curves, sectoral exposure). Mixing the two leads to unrealistic expectations.
Step-by-Step: Building Your Pre-AI Baseline
Ready to start? Do not wait until the AI contract is signed. Start today. Here is a practical checklist for establishing a credible baseline:
- Identify Key Workflows: Select 3-5 core tasks that are likely to be affected by AI (e.g., customer support responses, code reviews, marketing copy drafts).
- Define Success Metrics: For each task, define what "good" looks like. Is it speed? Accuracy? Customer happiness? Write down the exact KPIs.
- Collect Data for 4-6 Weeks: Use existing tools (Jira, Salesforce, time-tracking software) to gather historical data. Ensure you capture both output volume and quality indicators.
- Measure Time Allocation: Record how much time is spent on focused work vs. meetings vs. admin. This helps detect if AI saves time or just creates more busywork.
- Segment the Data: Break down the metrics by team, role, and experience level. Calculate averages for each group separately.
- Document Context: Note any seasonal factors, recent process changes, or external events that might skew the data. You want a "normal" state, not an anomaly.
Once you have this data, lock it in. This is your reference point. When you deploy the AI, you will measure against this snapshot. Any deviation-positive or negative-can then be attributed to the technology with greater confidence.
Avoiding Common Pitfalls
Even with good data, interpretation can go wrong. Watch out for these traps:
- The Halo Effect: Assuming that because the AI is smart, everything it touches improves. Always check quality metrics. Faster does not mean better.
- Ignoring Rework: If AI generates a draft that takes 20 minutes to fix, the time saved is negligible. Measure total cycle time, not just generation time.
- Short-Term Bias: Productivity often dips initially as users learn the new tool. Do not judge the AI after one week. Compare against the full baseline period.
- Uniform Targets: Do not apply the same productivity increase expectation to all employees. Adjust targets based on the stratified baselines discussed earlier.
Fairness is not just an ethical concern; it is a data integrity issue. If your baselines are biased, your AI strategy will be too.
How long should I collect baseline data before deploying AI?
You should collect data for at least 4 to 6 weeks. This duration allows you to smooth out daily fluctuations, account for weekly cycles (like Monday rushes or Friday slowdowns), and establish a stable average. Shorter periods may capture anomalies rather than typical performance.
What if my company doesn't have detailed time-tracking data?
Start with what you have. Even rough estimates of task completion times and error rates are better than nothing. You can supplement this with manual time logs for a sample of employees during the baseline period. The goal is consistency, not perfection.
Does generative AI always improve productivity?
No. While studies show average gains of 30% in suitable tasks, AI can reduce productivity in complex, creative, or highly contextual roles if not implemented correctly. It can also introduce new risks like hallucinations or compliance errors that require additional oversight time.
How do I measure the quality of AI-generated work?
Use existing quality metrics such as customer satisfaction scores (CSAT), error rates, or peer review scores. Establish these metrics during the baseline phase. Post-deployment, compare the quality of AI-assisted outputs directly against the baseline quality standards.
Why is stratifying baselines by skill level important?
Generative AI tends to help less experienced workers more significantly than experts. Using a single average baseline can mask this disparity, leading to unfair performance evaluations and missed opportunities to support those who benefit most.
 Artificial Intelligence