
Tag: data visualization
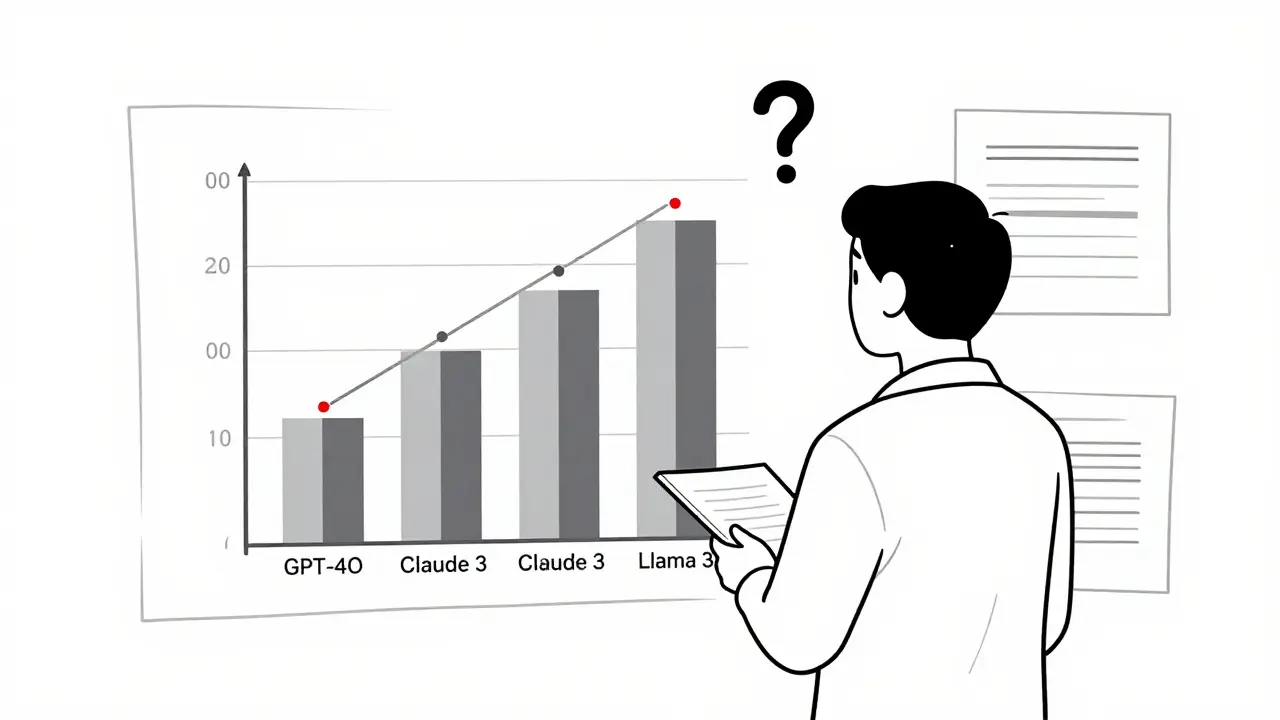
Learn how to visualize LLM evaluation results effectively using bar charts, scatter plots, heatmaps, and parallel coordinates. Avoid common pitfalls and choose the right tool for your needs.
Categories
 Artificial Intelligence
Archives
Recent-posts

How Domain Experts Turn Spreadsheets into Applications with Vibe Coding
Feb, 18 2026

Domain-Specialized Large Language Models: Code, Math, and Medicine
Oct, 3 2025

Marketing Content at Scale with Generative AI: Product Descriptions, Emails, and Social Posts
Jun, 29 2025

Token Probability Calibration in Large Language Models: How to Fix Overconfidence in AI Responses
Jan, 16 2026

Fintech Experiments with Vibe Coding: Mock Data, Compliance, and Guardrails
Jan, 23 2026