
Tag: data visualization
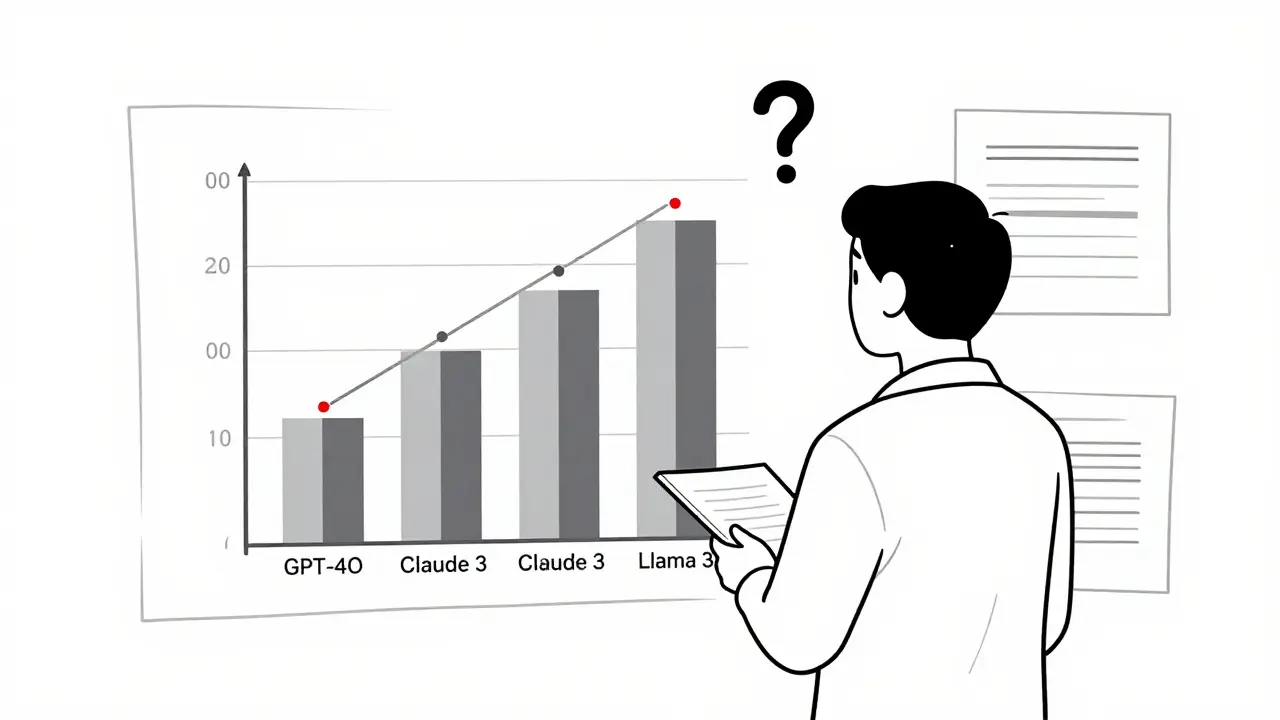
Learn how to visualize LLM evaluation results effectively using bar charts, scatter plots, heatmaps, and parallel coordinates. Avoid common pitfalls and choose the right tool for your needs.
Categories
 Artificial Intelligence
Archives
Recent-posts

Performance Budgets for Frontend Development: Set, Measure, Enforce
Jan, 4 2026

Service Level Objectives for Maintainability: Key Indicators and How to Set Alerts
Mar, 16 2026

Data Minimization Strategies for Generative AI: Collect Less, Protect More
Jun, 25 2026
How to Measure Generative AI ROI: Solving Attribution Challenges in 2026
May, 17 2026

Domain-Specialized Large Language Models: Code, Math, and Medicine
Oct, 3 2025