
Tag: evaluation benchmarks
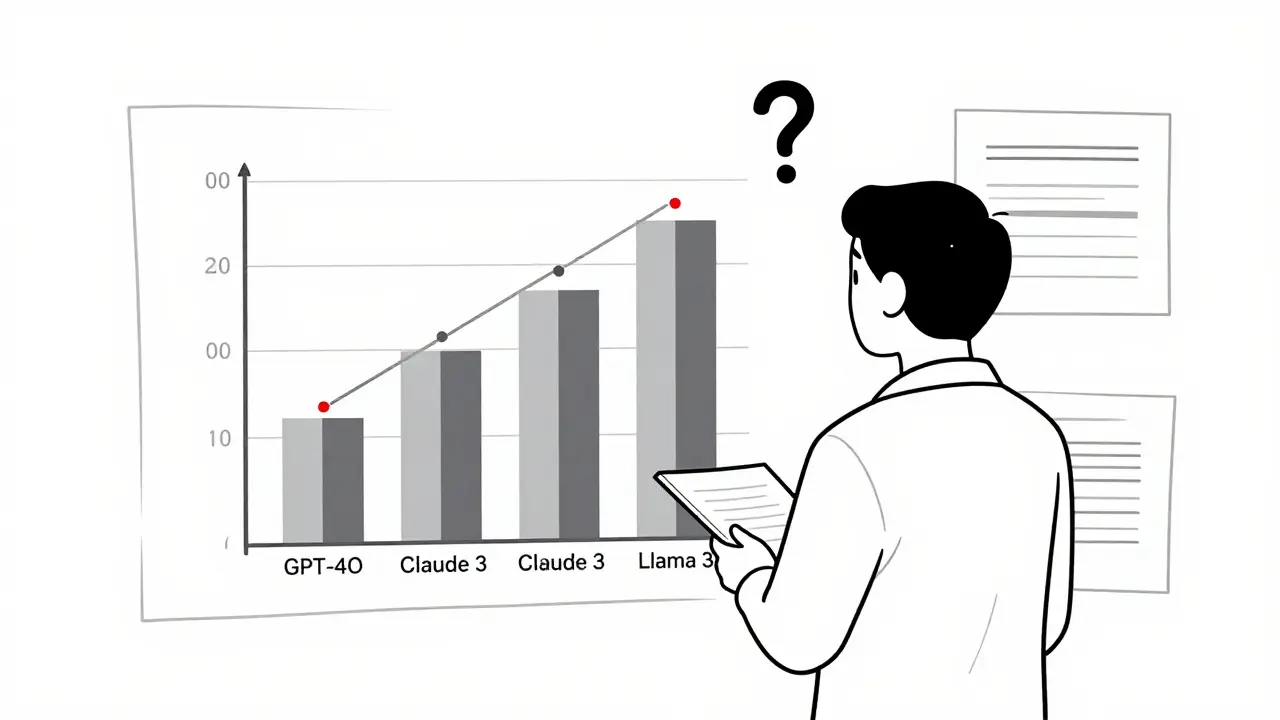
Learn how to visualize LLM evaluation results effectively using bar charts, scatter plots, heatmaps, and parallel coordinates. Avoid common pitfalls and choose the right tool for your needs.
Categories
 Artificial Intelligence
Archives
Recent-posts

How Startups Use Vibe Coding for Rapid Prototyping and MVP Development
Jun, 2 2026

Data Privacy for Large Language Models: Principles and Practical Controls
Jan, 28 2026

Why Understanding Every Line of AI-Generated Code Isn't the Goal in Vibe Coding
Mar, 27 2026

Secure Branch Protection for Vibe-Coded Repositories: A 2026 Guide
May, 14 2026

Fine-Tuning Multimodal AI: Dataset Design, Alignment Losses, and PEFT Strategies
Jun, 24 2026