
Tag: LLM evaluation
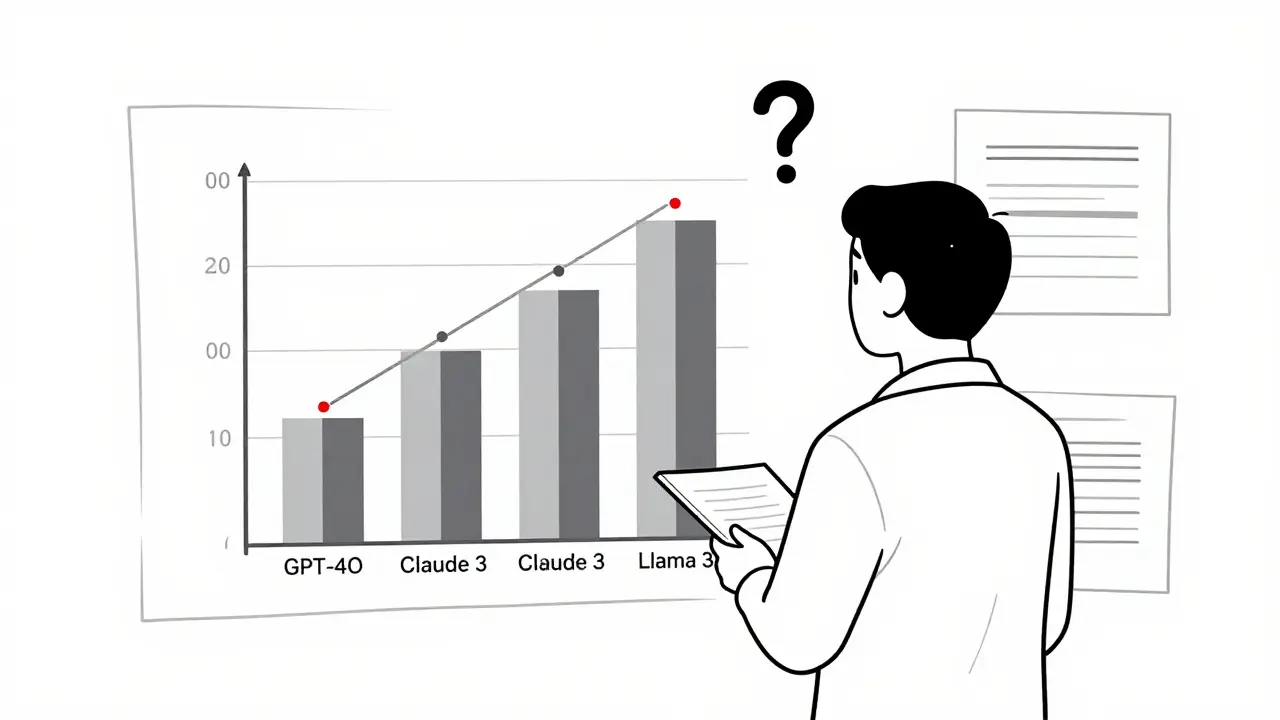
Learn how to visualize LLM evaluation results effectively using bar charts, scatter plots, heatmaps, and parallel coordinates. Avoid common pitfalls and choose the right tool for your needs.
Categories
 Artificial Intelligence
Archives
Recent-posts

How to Choose the Right Embedding Model for Your Enterprise RAG Pipeline
Feb, 26 2026

How to Choose Batch Sizes to Minimize Cost per Token in LLM Serving
Jan, 24 2026

Architectural Innovations Powering Modern Generative AI Systems
Jan, 26 2026

Enterprise Adoption, Governance, and Risk Management for Vibe Coding
Dec, 16 2025

Procuring AI Coding as a Service: Contracts and SLAs for Government Agencies
Aug, 28 2025