
Tag: model performance
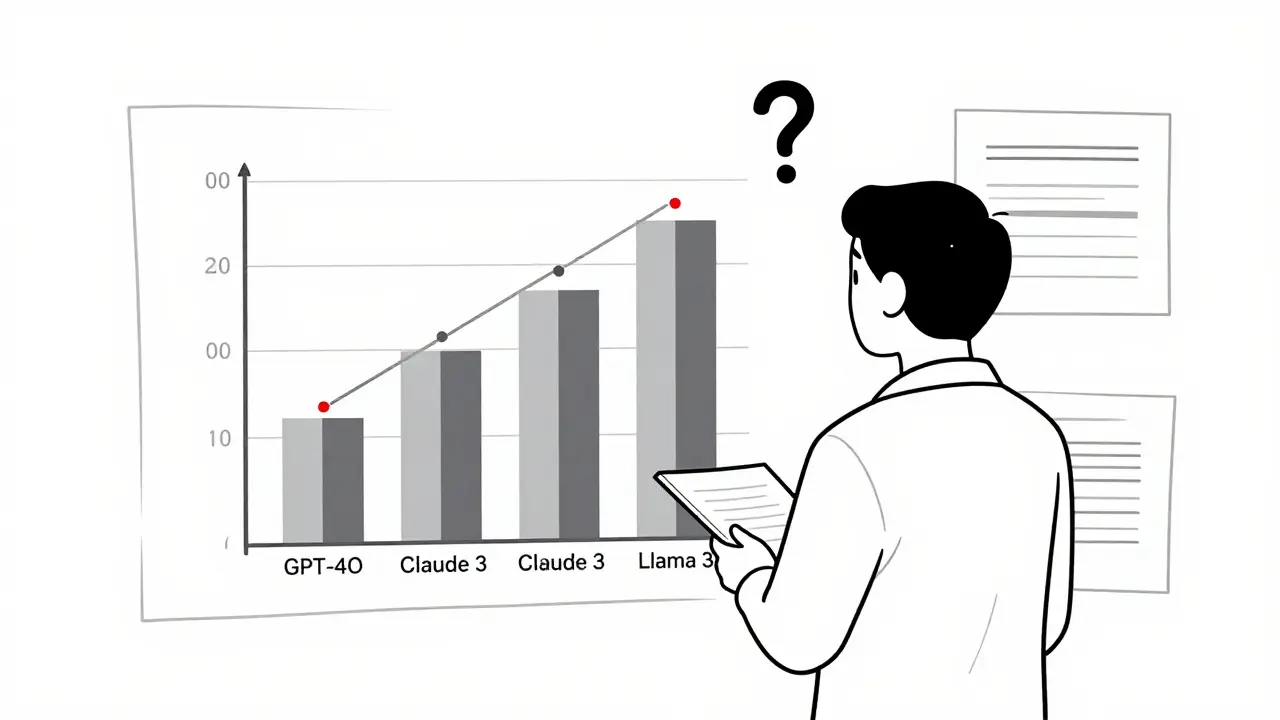
Learn how to visualize LLM evaluation results effectively using bar charts, scatter plots, heatmaps, and parallel coordinates. Avoid common pitfalls and choose the right tool for your needs.
Categories
 Artificial Intelligence
Archives
Recent-posts
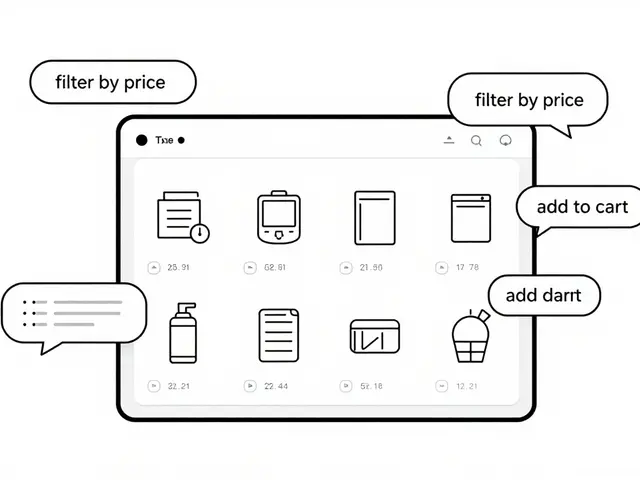
Vibe Coding for E-Commerce: Rapid Launch of Product Catalogs and Checkout Flows
May, 23 2026

Why Understanding Every Line of AI-Generated Code Isn't the Goal in Vibe Coding
Mar, 27 2026

Tokenizer Design Choices and Their Impacts on LLM Quality
Apr, 6 2026

Edge Inference for Small Language Models: When On-Device Makes Sense
Apr, 4 2026

Vibe Coding for Full-Stack Apps: What to Expect from AI Implementations
Feb, 21 2026