
Tag: visualization techniques
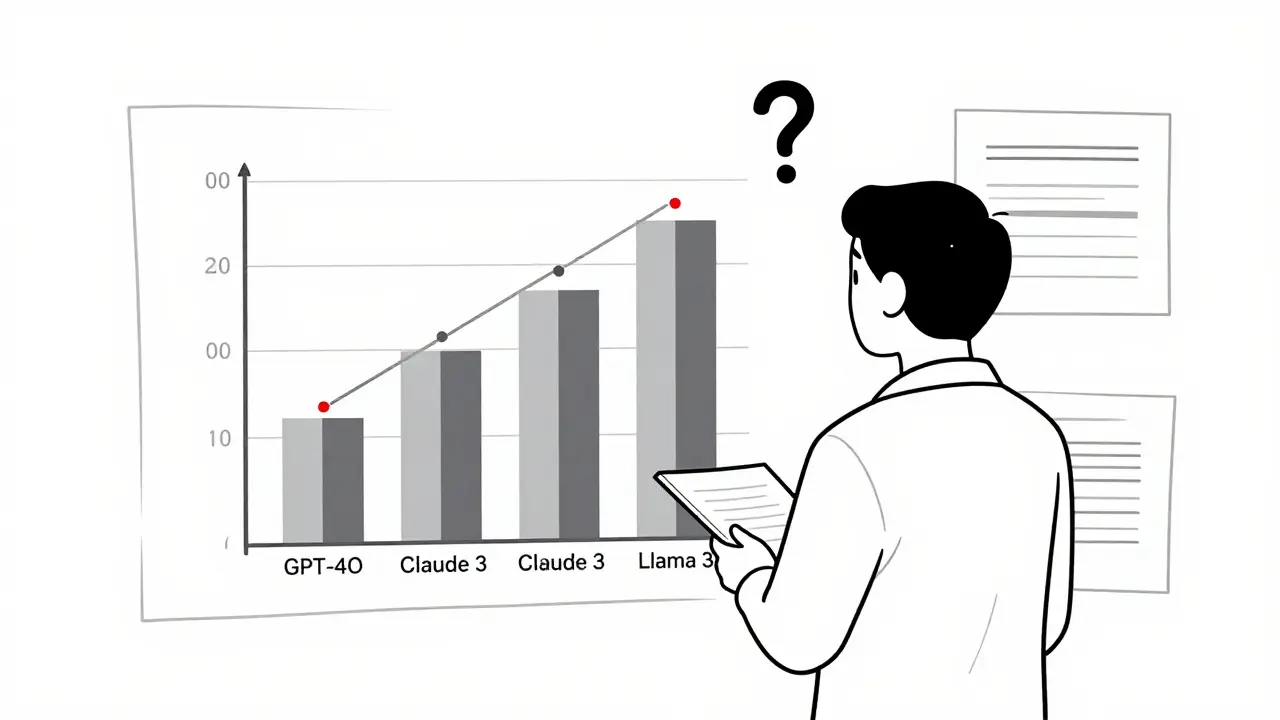
Learn how to visualize LLM evaluation results effectively using bar charts, scatter plots, heatmaps, and parallel coordinates. Avoid common pitfalls and choose the right tool for your needs.
Categories
 Artificial Intelligence
Archives
Recent-posts

Compressed LLM Evaluation: Essential Protocols for 2026
Feb, 5 2026

Private Prompt Templates: How to Prevent Inference-Time Data Leakage in AI Systems
Aug, 10 2025

How Large Language Models Capture Semantics and Syntax through Self-Supervision
May, 12 2026

Human-in-the-Loop for Generative AI: How to Catch Hallucinations Before They Hit Users
May, 15 2026

How to Choose Batch Sizes to Minimize Cost per Token in LLM Serving
Jan, 24 2026